/Fiserv%2C%20Inc_%20offices-by%20JHVEPhoto%20via%20iStock.jpg)
Fiserv, Inc. (FI) stock has declined by over 13% in the last week since its Q2 earnings were released. But was it really all that bad? After all, it generated strong earnings and free cash flow. FI stock looks cheap here. Short OTM puts for a lower buy-in.
FI is at $142.50, down from $165.98 on July 22, just before its July 23 Q2 earnings release. This is well below its $237.79 peak on March 3.
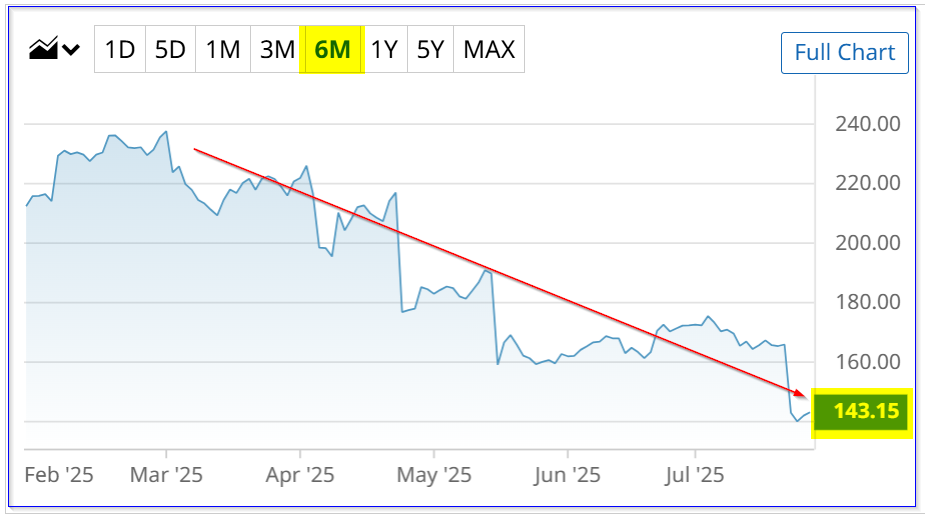
Based on its historical averages and free cash flow, FI stock could be worth at least 28% more at $182.00 per share.
Moreover, one way to set a lower buy-in is to short out-of-the-money (OTM) put options. This article will delve into that.
Good Earnings and Free Cash Flow (FCF)
Fiserv, the payments and financial security solutions company, said its Q2 adjusted revenue was up 8% YoY, and adjusted earnings per share (EPS) rose 16%. This included an increase in its adjusted operating margin for the first half to almost 40% (39.6%).
Moreover, its Q2 free cash flow (FCF) was up substantially to almost $1.2 billion, or 21.5% of sales. In the trailing 12 months (TTM) period, it has generated $5.157 billion in FCF according to Stock Analysis, although Fiserv says on page 3 and page 8 of its deck that it was $5.299 billion.
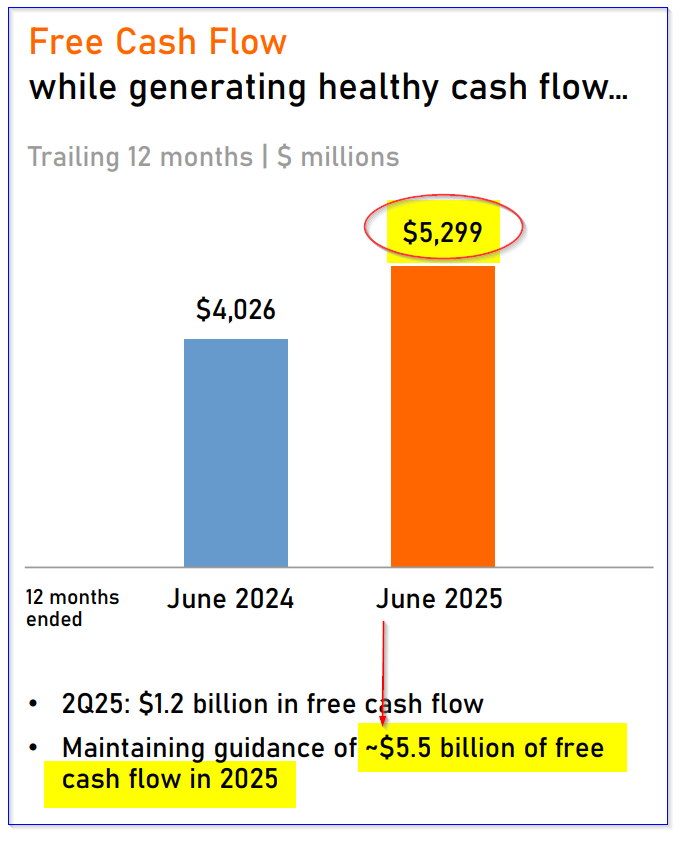
That works out to a 24.4% FCF margin using the Stock Analysis figures and 25.1% using Fiserv's TTM number. We can use that to estimate its FCF in the next 12 months (NTM).
Projecting FCF for Fiserv
Management said its estimate is $5.5 billion in FCF for 2025. Let's look at that. Right now, analysts are projecting $20.78 billion in revenue for 2025. So, using a 25% FCF margin:
$20.78 billion x 0.25 = $5.195 billion FCF
However, next year, analysts foresee revenue of $22.46 billion. Using a 25% FCF margin, FCF could hit $5.615 billion.
That means FCF could range between $5.2 and $5.6 billion over the next 12 months, using a 25% FCF margin. So, management's estimate of $5.5 billion for 2025 could imply its FCF margin will rise.
However, if Fiserv hits $5.5 billion this year and $5.6 billion next year, it's likely the FI stock could rise.
FCF-Based Target Price For FI Stock
Fiserv does not pay a dividend. Let's assume it paid out 100% of its free cash flow. What would the dividend yield be?
One way to estimate this is to use its historical FCF yield. For example, given its market cap today of $77.89 billion, according to Yahoo! Finance, and using its TTM FCF:
$5.299 billion TTM FCF / $77.89 billion mkt cap = 0.0.68 = 6.8% FCF yield
So, let's assume that the market would improve this yield slightly to 6.60% (i.e., its potential dividend yield assuming a 100% FCF payout). That would happen if its next 2025 FCF hits $5.5 billion, as management projects (due to its buybacks and improved outlook):
$5.5 billion FCF est. for 2025 / 0.066 = $83.33 billion mkt cap
That implies the market value of FI stock could rise by +7.0% over its $77.89 billion market cap.
Moreover, next year, if the FCF hits $5.615 billion (see above) and the FCF yield (i.e., a potential dividend yield) improves to 6.50%:
$5.615 FCF 2026 est. / 0.065 = $86.39 billion mtk cap, or +9.5%
So, over the next 12 months (NTM) the price target is between +7.0% and +9.5%, or +8.25%. That puts the price target at $154.49:
$142.72 x 1.0825 = $154.49
However, that is not the only way to forecast a price target for FI stock. Let's also look at its historical price/earnings multiples.
P/E Based Price Target
For example, Morningstar reports that the average forward price/earnings (P/E) multiple over the last 5 years has been 17.1x. Seeking Alpha's analysis says it's been 18.71x.
Now, management at Fiserv has already projected that its 2025 earnings per share (EPS) will be between $10.15 EPS and $10.30, or a growth of +15% to $17% over 2024.
So, using a midpoint EPS of $10.23 and a forward P/E of 17.9 (the average of the two surveys):
$10.23 EPS x 17.91 = $183.12 target price
That is +28.3% over today's price. Moreover, next year analysts are projecting EPS of $11.82 according to Seeking Alpha. So, that results in a projected price target of $211.58, or +48% upside from here.
The bottom line is that FI stock looks very cheap using its historical P/E metrics.
Analysts Agree FI Looks Undervalued
Yahoo! Finance's survey of 34 analysts shows an average price target of $187.00, and Barchart's mean survey price is even higher at $206.38.
That coincides with AnaChart's price target of $226.04 and Stock Analysis's average of $214.12 from 26 analysts.
So, the average survey price target from analysts is $208.39, or +46% upside from today.
Summary of Price Targets
Using these three methods, you can see that FI stock looks deeply undervalued:
FCF-Based Target ………. $154.49
P/E-Based Target ………… $183.12
Analysts' Targets …………. $208.39
Average Price Target ……. $182.00, or +27.7% over $142.50 today.
But, for some reason, the stock is falling, and it might make sense to set a lower buy-in target. This can be done by selling short out-of-the-money (OTM) put options. That way, an investor can get paid while waiting to potentially acquire shares.
Shorting OTM Puts
For example, the $135 strike price put option for the Aug. 29 expiration period has a midpoint premium of $1.60 per put contract. This strike price is over 5% lower than today's price (i.e., is out-of-the-money) for the next 32 days.
That provides an investor who does an order to “Sell to Open” an immediate yield of 1.18% (i.e., $1.60/$135.00).
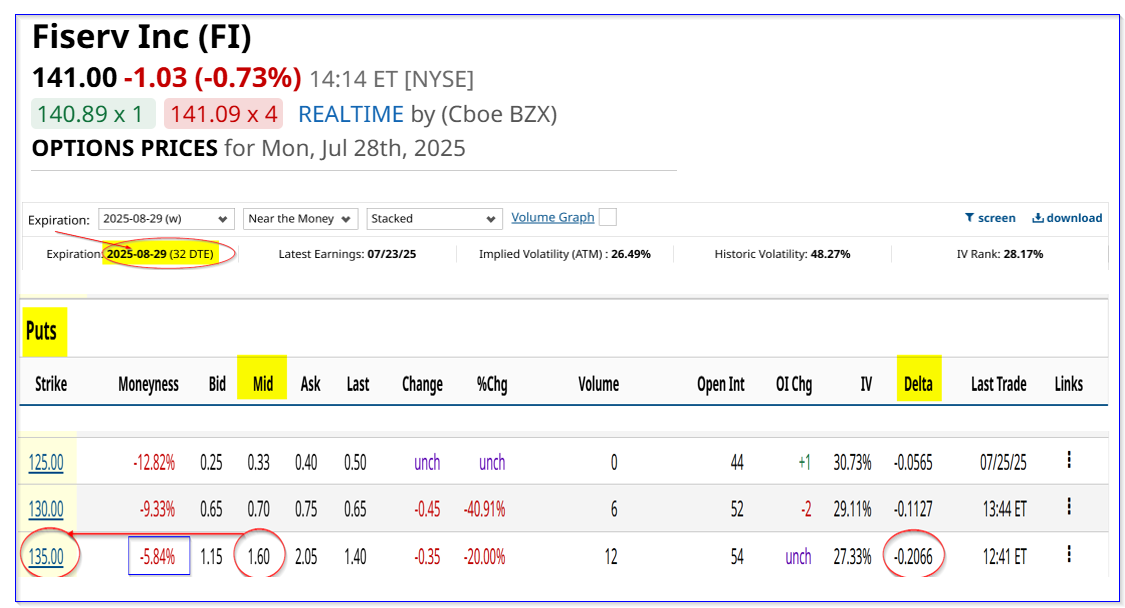
That means that even if FI stock falls to $135 on or before Aug. 29, the investor's breakeven point is $135-$1.60, or $133.40. That's -5.39% below today's price and provides good downside protection.
Note that the risk seems low that the stock will fall this much, as the delta ratio is only 20.66%. Moreover, the potential upside is attractive:
$182.00 target / $133.40 breakeven = 1.364 = +36.4% upside
And think about this. If the investor can repeat this play over the next 3 months, the expected return (ER) is 3.50%. That is even if FI stock stays flat or falls less than 5.39% to the breakeven point.
The bottom line here is that Fiserv stock looks very cheap. One way to play this and to set a lower buy-in point is to short OTM puts in nearby expiry periods.
On the date of publication, Mark R. Hake, CFA did not have (either directly or indirectly) positions in any of the securities mentioned in this article. All information and data in this article is solely for informational purposes. For more information please view the Barchart Disclosure Policy here.