Applied Materials, Inc. (AMAT) is honing its efforts on integrating artificial intelligence (AI) to enhance the efficiency of chip manufacturing. In an industry landscape where AI continues to gain prominence, the proliferation of chip production is anticipated. As we traverse through this AI-propelled era, AMAT might prove a prudent investment.
Generating revenue and earnings at the high end of its guidance range in its third quarter ended July 30, 2023, the company has effectively demonstrated its market prowess.
“Over the past several years, we have focused our strategy and investments on key technologies to accelerate the Internet of Things and AI era, enabling us to consistently deliver strong results in 2023 and positioning Applied Materials for sustainable outperformance,” said Gary Dickerson, President and CEO.
Herein are several pivotal metrics underpinning my bullish outlook on the company.
Analyzing Applied Materials Inc. Financial Performance: A Review of Revenue, Gross Margin, and Other Key Metrics (2020 - 2023)
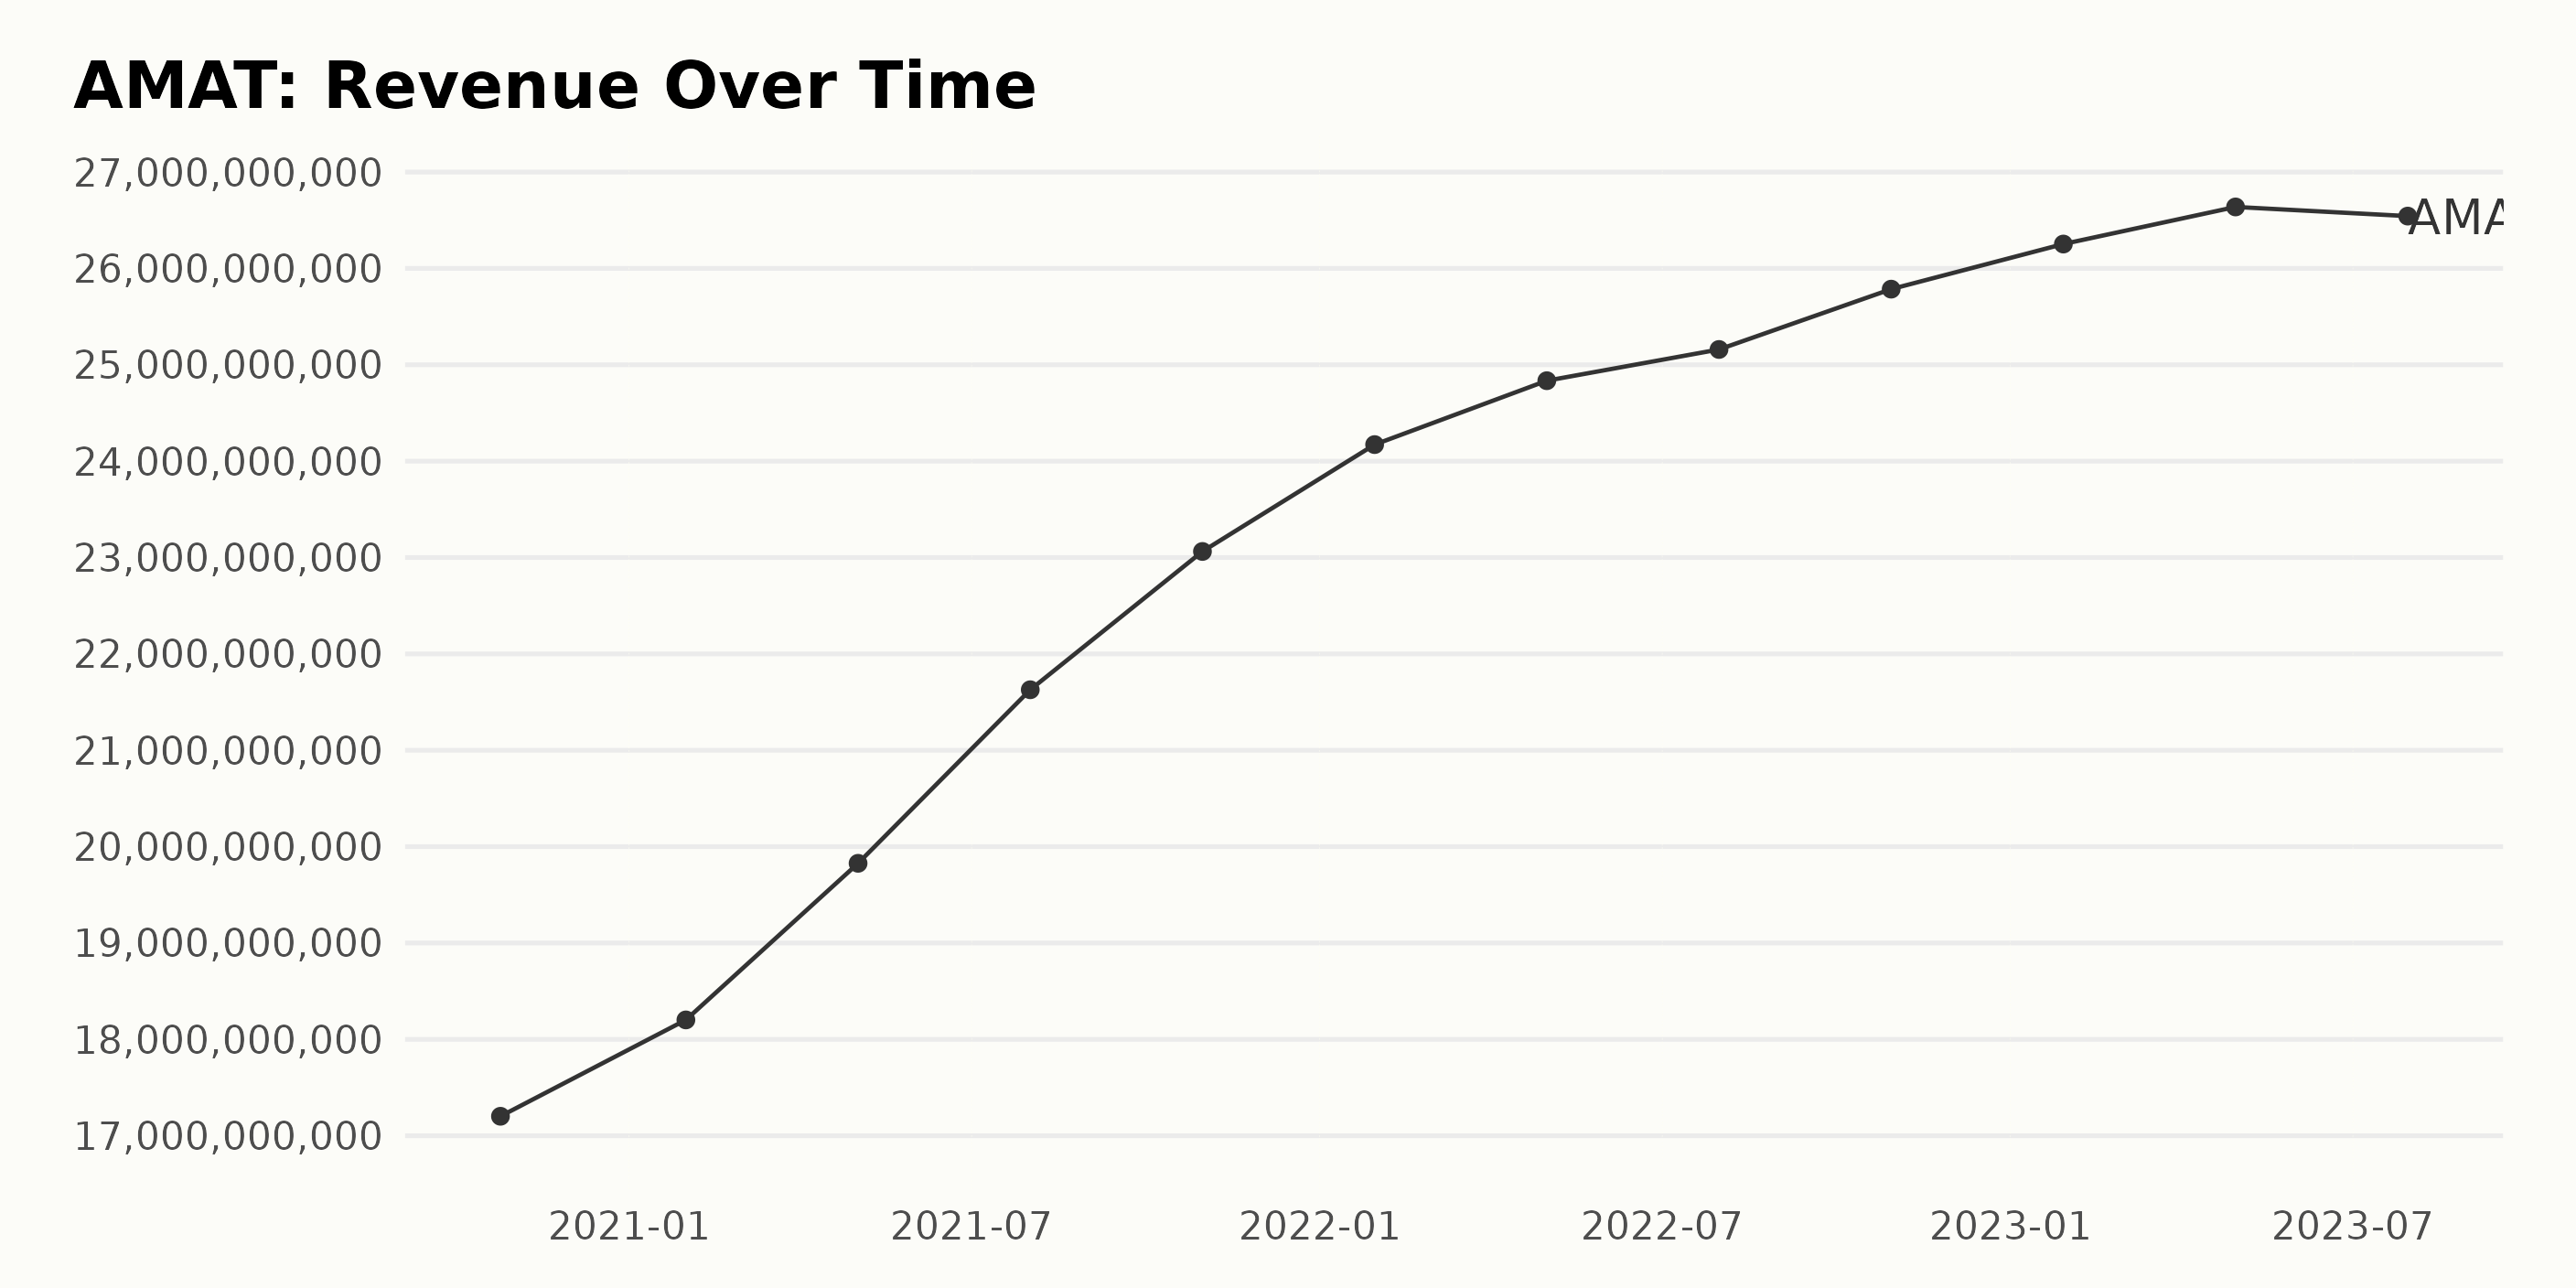
The trend of the trailing-12-month revenue of AMAT shows a significant rise from October 2020 to July 2023, with some fluctuations. Here are the key points:
October 2020: The revenue stood at $17.20 billion.
January 2022: An upward trend is visible as the revenue increased to $24.17 billion.
July 2022: A minor slowdown in the growth rate as revenue increased marginally to $25.16 billion.
October 2022: A noticeable rebound took place, and the revenue rose to $25.78 billion.
January 2023: Starting the year on a high note, the revenue further increased to $26.25 billion.
April 2023: A slight increase was observed, with the revenue reaching $26.64 billion.
July 2023: In an unexpected turn, the revenue dropped slightly to $26.54 billion.
Notwithstanding the fluctuations, the overall trend shows significant growth. When comparing the last value from the first (October 2020 with July 2023), there is clear growth from $17.20 billion to $26.54 billion, equating to a 54.31% increase. It is important to note the emphasis on more recent data and the last value in the series, which indicates a slight drop, however, the long-term trend has been largely positive.
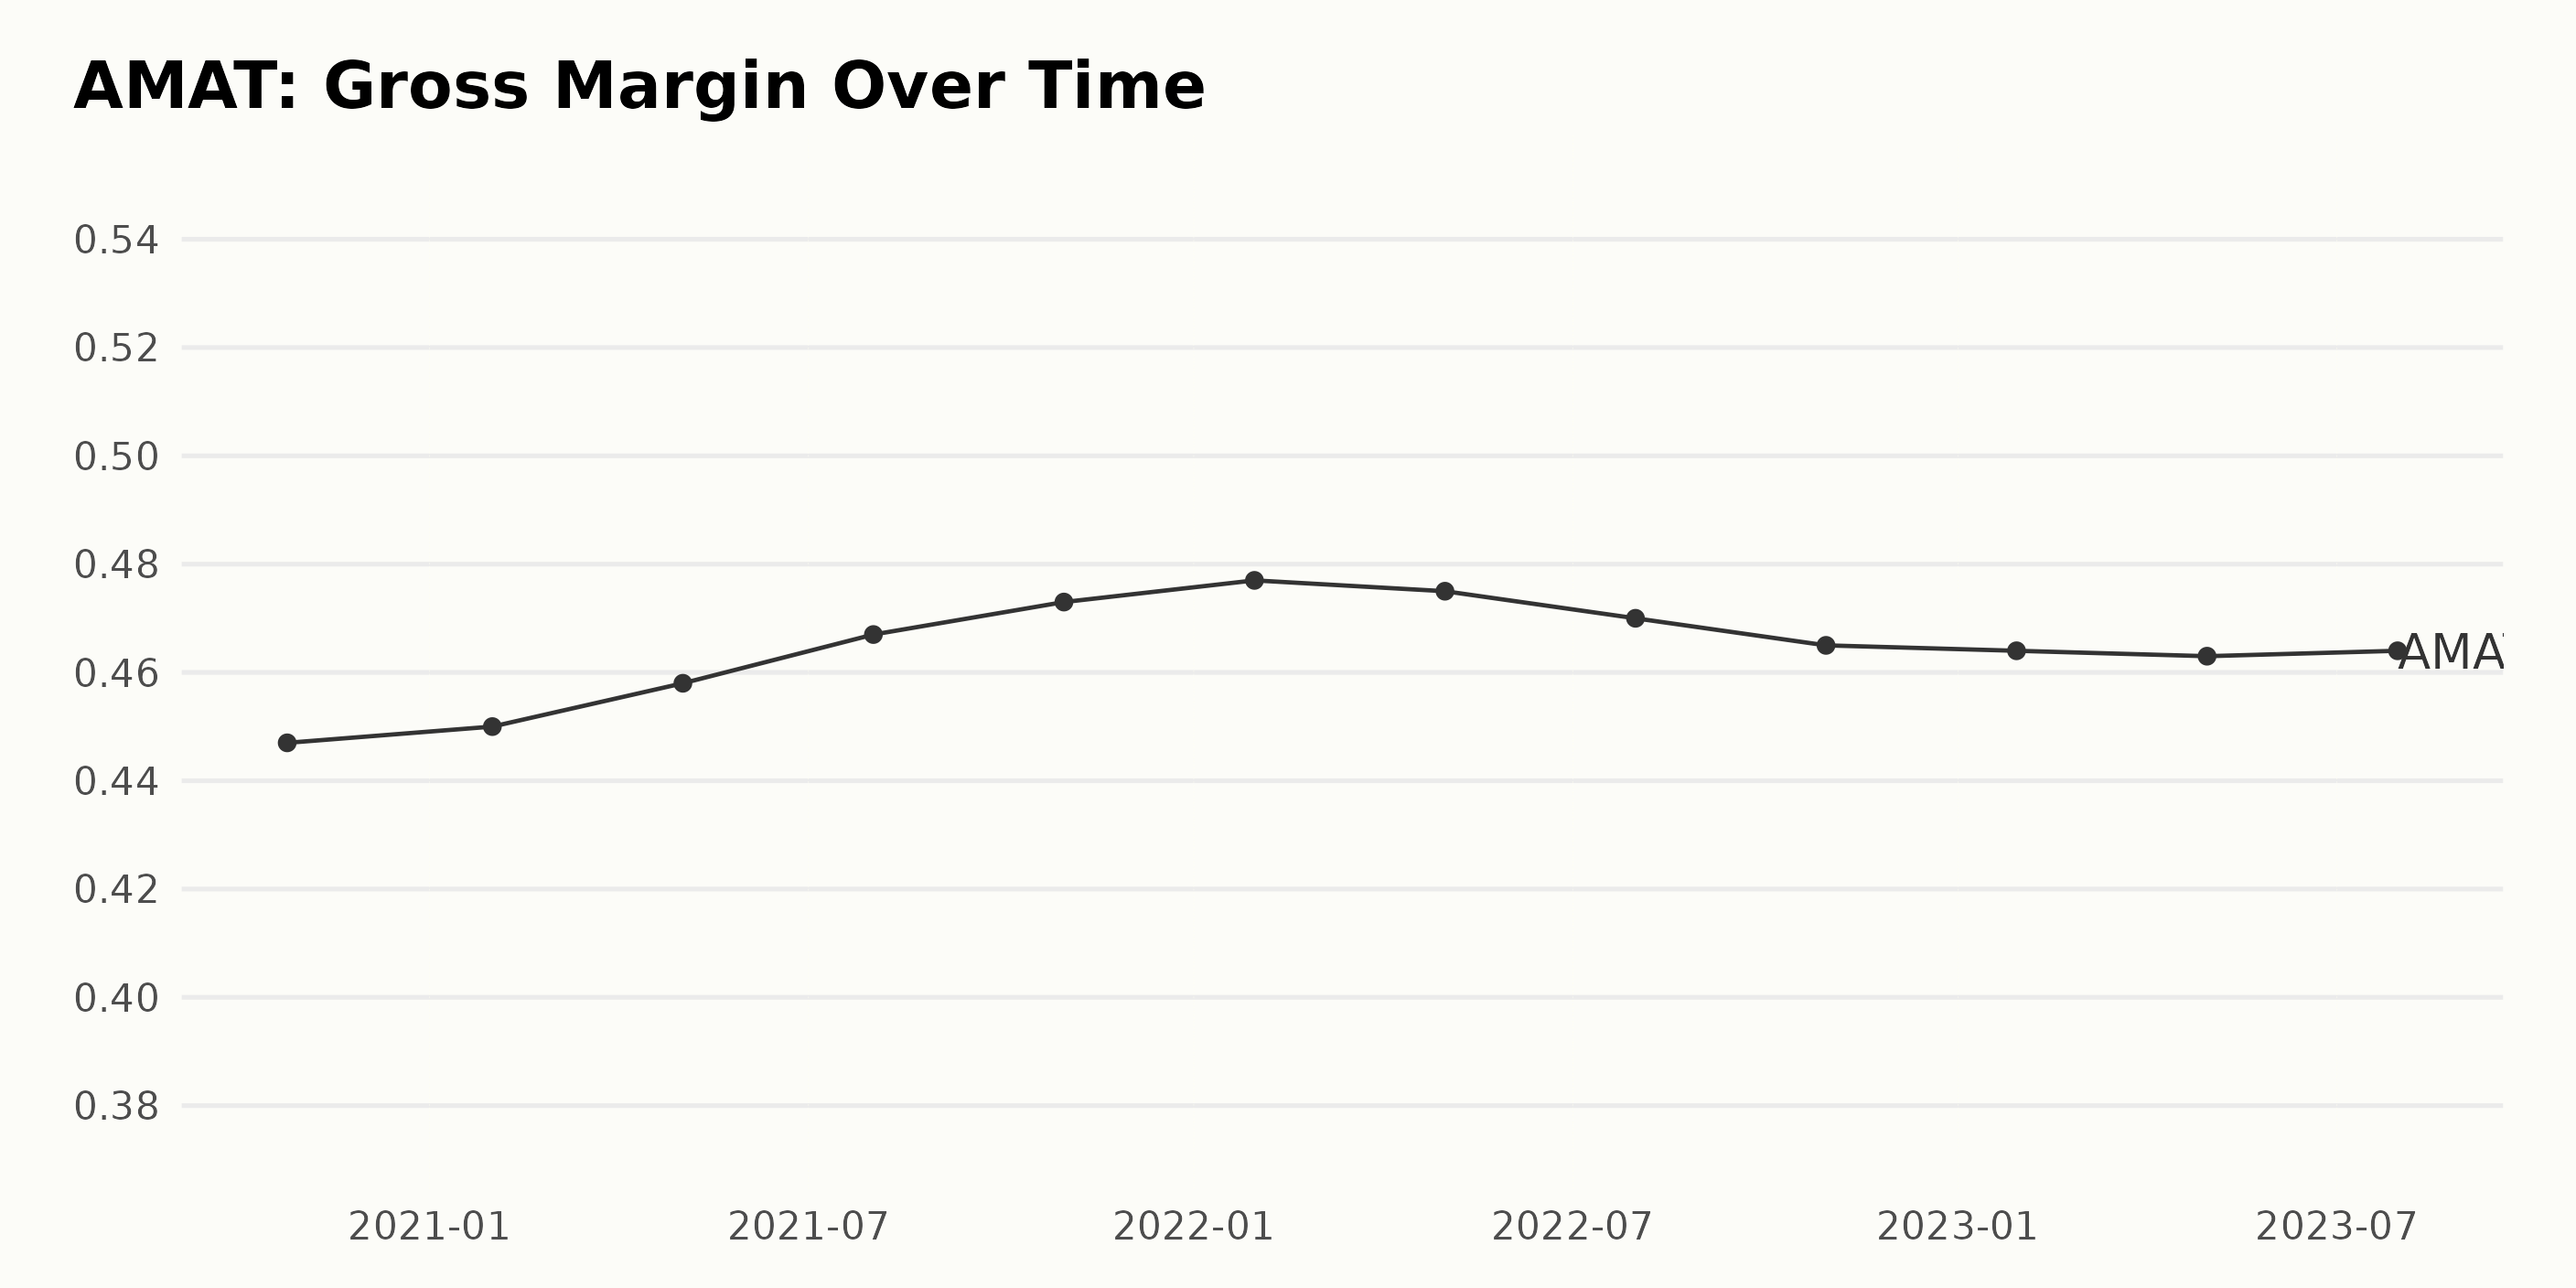
The data series indicates a general upward trend in the Gross Margin of AMAT from October 2020 to January 2023. Here are the key highlights for each data point:
- October 25, 2020: 44.7%
- January 31, 2021: 45%
- May 2, 2021: 45.8%
- August 1, 2021: 46.7%
- October 31, 2021: 47.3%
- January 30, 2022: 47.7%
- May 1, 2022: 47.5%
- July 31, 2022: 47%
- October 30, 2022: 46.5%
- January 29, 2023: 46.4%
- April 30, 2023: 46.3%
- July 30, 2023: 46.4%
Between October 2020 and July 2023, the Gross Margin increased from 44.7% to 46.4%, reflecting a growth rate of 3.8%. The peak value within this period was observed on January 30, 2022, at 47.7%.
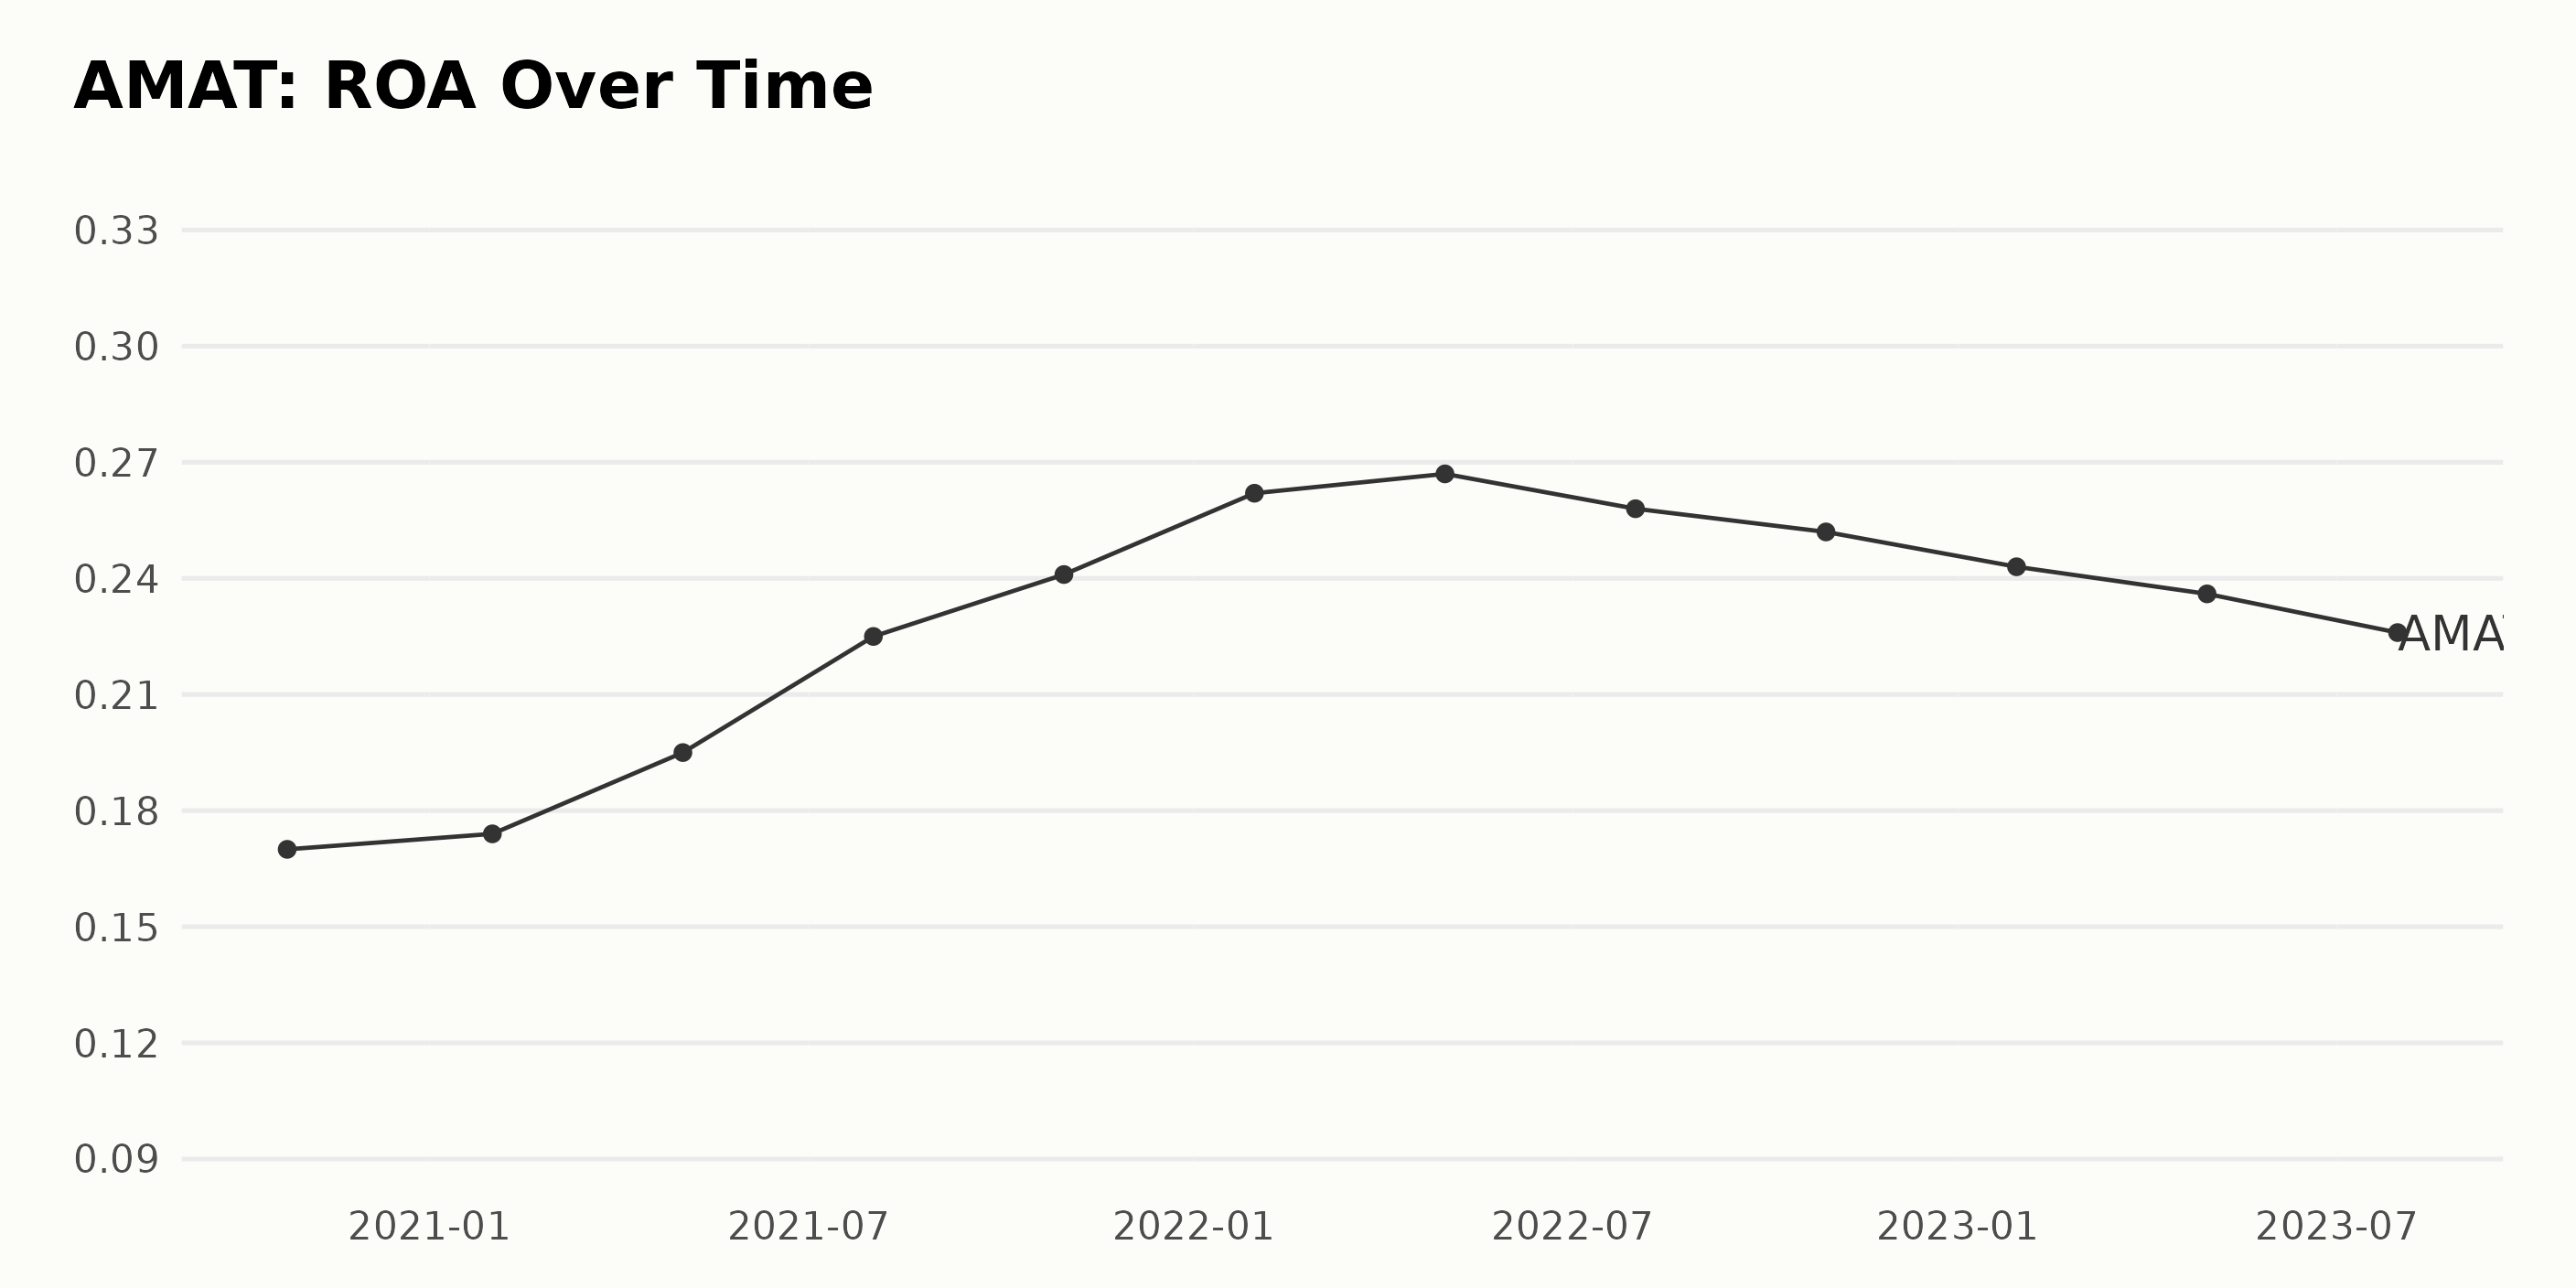
The data series shows a progression of the Return on Assets (ROA) for AMAT from October 25, 2020, to July 30, 2023. Here are the key points:
- The earliest recorded ROA was 0.17 in October 2020.
- From 2020 to mid-2022, AMAT’s ROA showed a steady increase, reaching a peak value of 0.267 in May 2022.
- The highest growth rate was observed between January 31, 2021, and May 2, 2021, where the ROA increased from 0.174 to 0.195.
- Despite a small fluctuation noted in July 2022, where the ROA decreased slightly to 0.258, it continued its upward trend till October 2022, registering an ROA of 0.252.
- However, after October 2022, AMAT’s ROA began declining. This downward movement continued through to July 30, 2023, where the last notable value was 0.226.
Therefore, the net change in ROA over the full period represents a growth rate of approximately 33% (calculated by comparing the first value of 0.17 in October 2020 with the final value of 0.226 in July 2023).
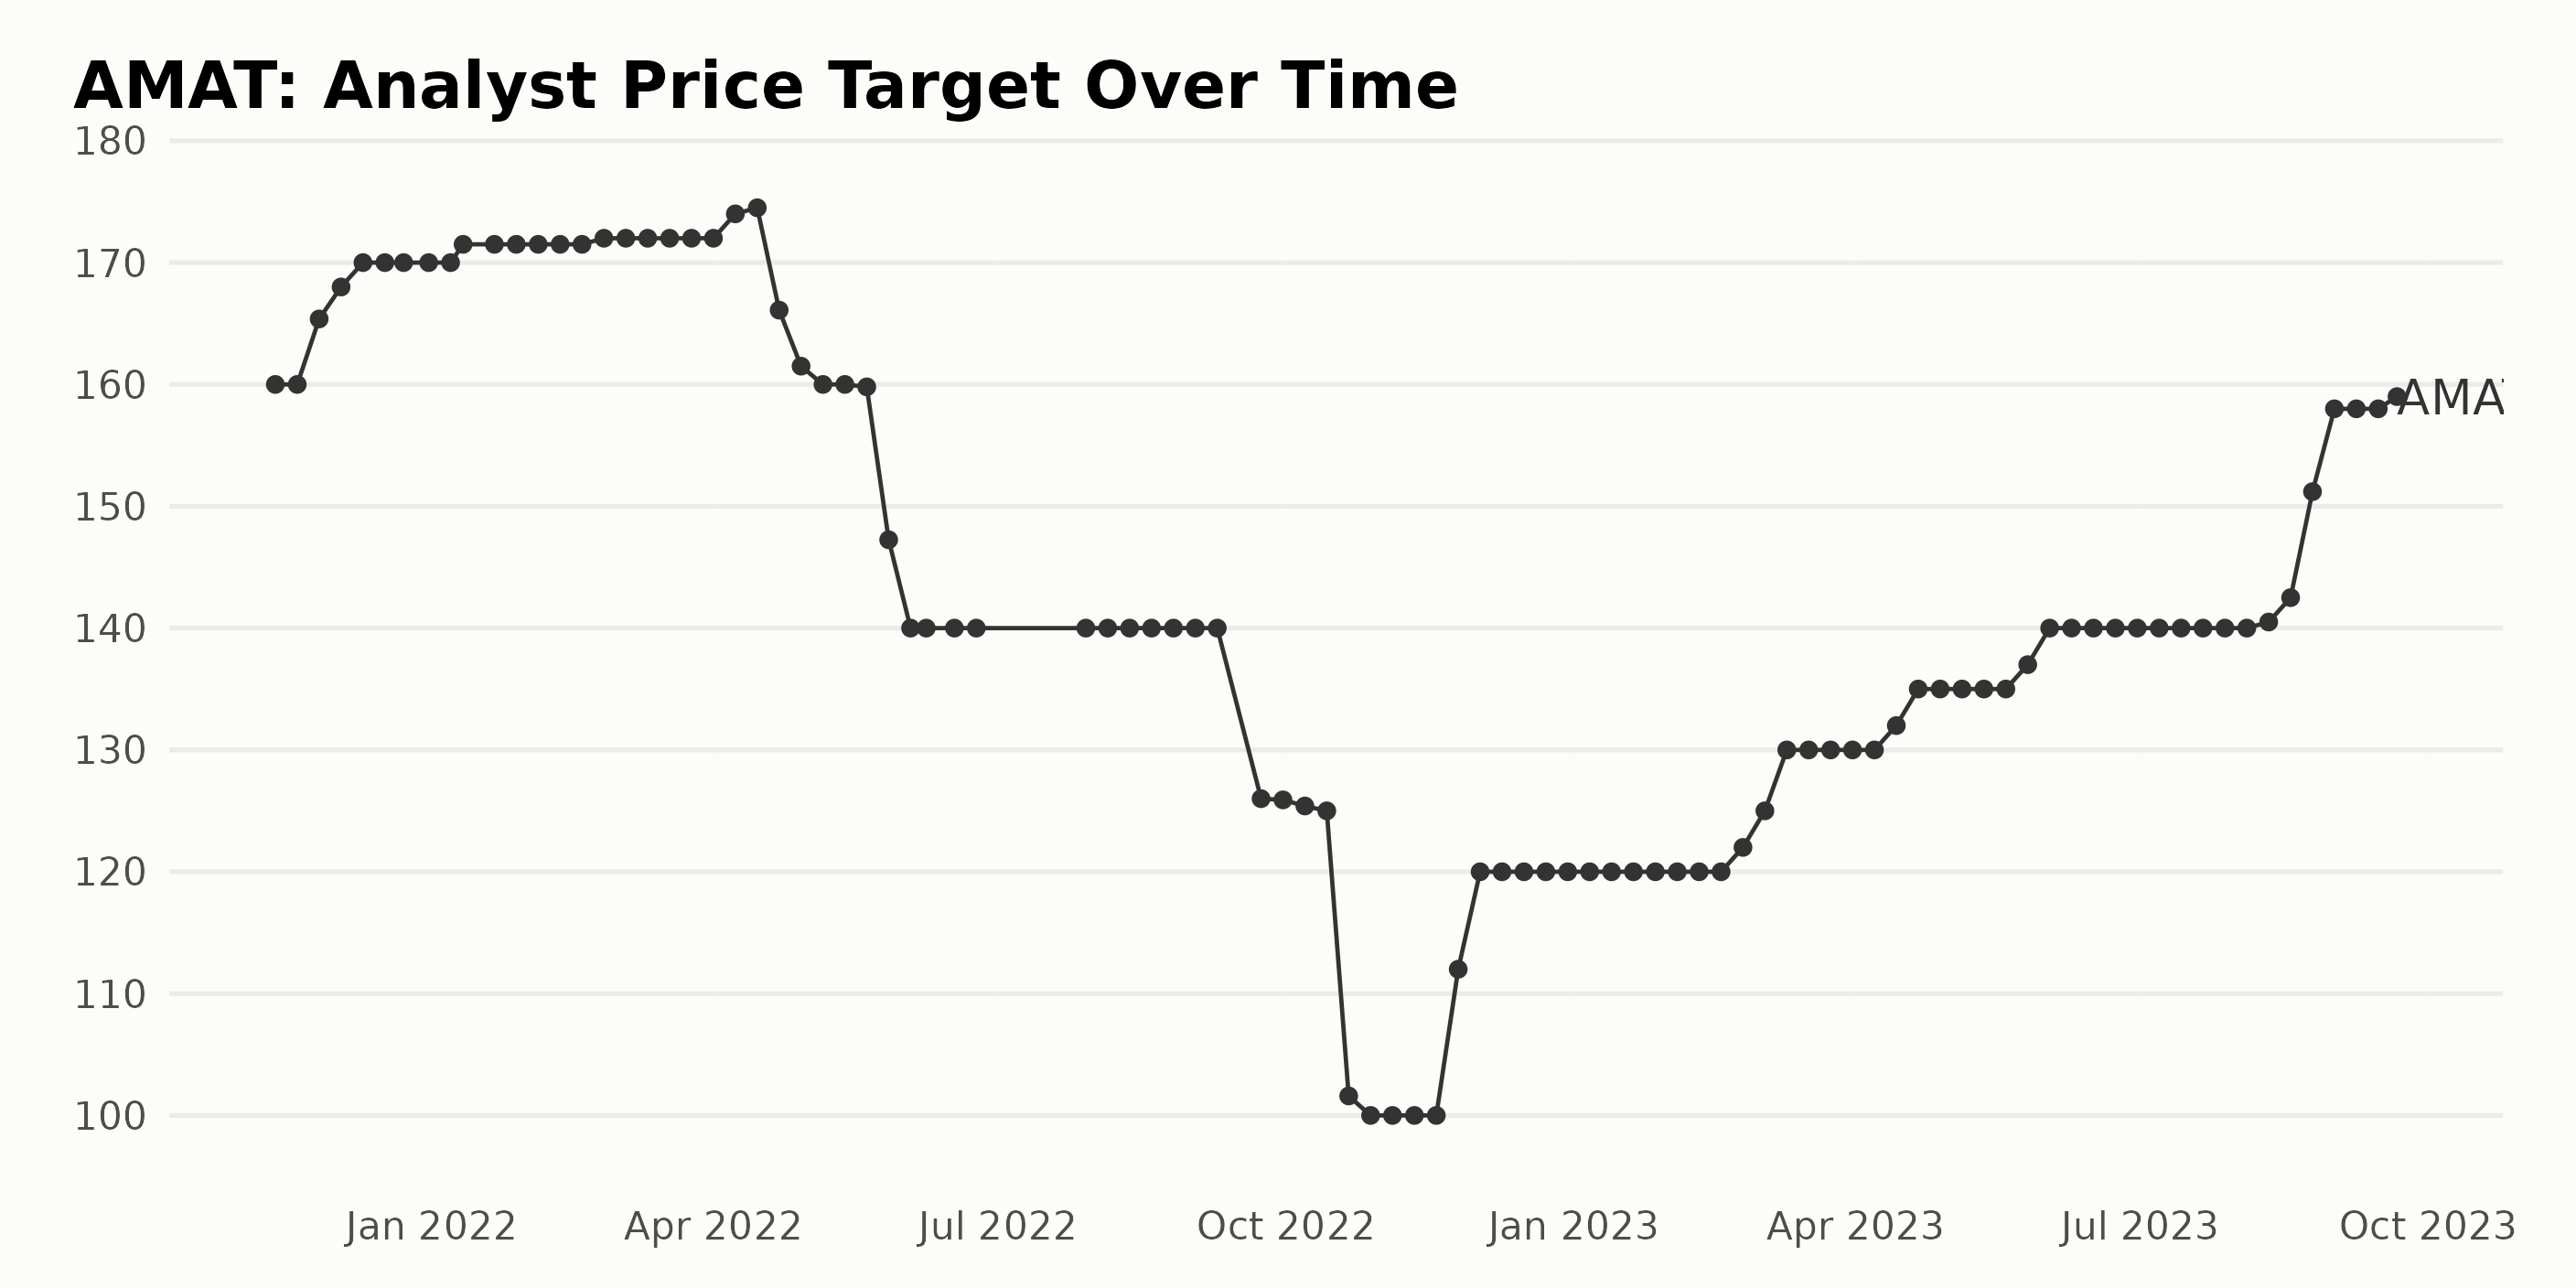
The Analyst Price Target trend for AMAT shows noticeable fluctuations over the 2-year period from November 2021 to September 2023. Throughout this duration, the data indicates certain ascents and descents, with the largest declines towards the end of 2022 and a subsequent rebound in late 2023. Here’s the summary:
- Starting at $160 in November 2021, the Analyst Price Target saw a mild increase, reaching $172 by March 2022.
- A significant drop was noted from April 2022, hitting a low point of $100 by October 2022. This represented a decrease of around 42% from the March value.
- The price target remained stable at $120 from December 2022 until February 2023, followed by a slow and steady rise to $140 by June 2023.
- The figures maintained stability again at $140 throughout the summer of 2023 (July and August).
- Post-August, the value surged notably, ending at $159 on September 21, 2023.
The calculated overall growth rate, taking the first value ($160) from the last ($159), shows a slight decrease of less than 1%. However, it should be stressed that the most recent data suggests an upward trend in the Analyst Price Target for Applied Materials Inc. (AMAT).
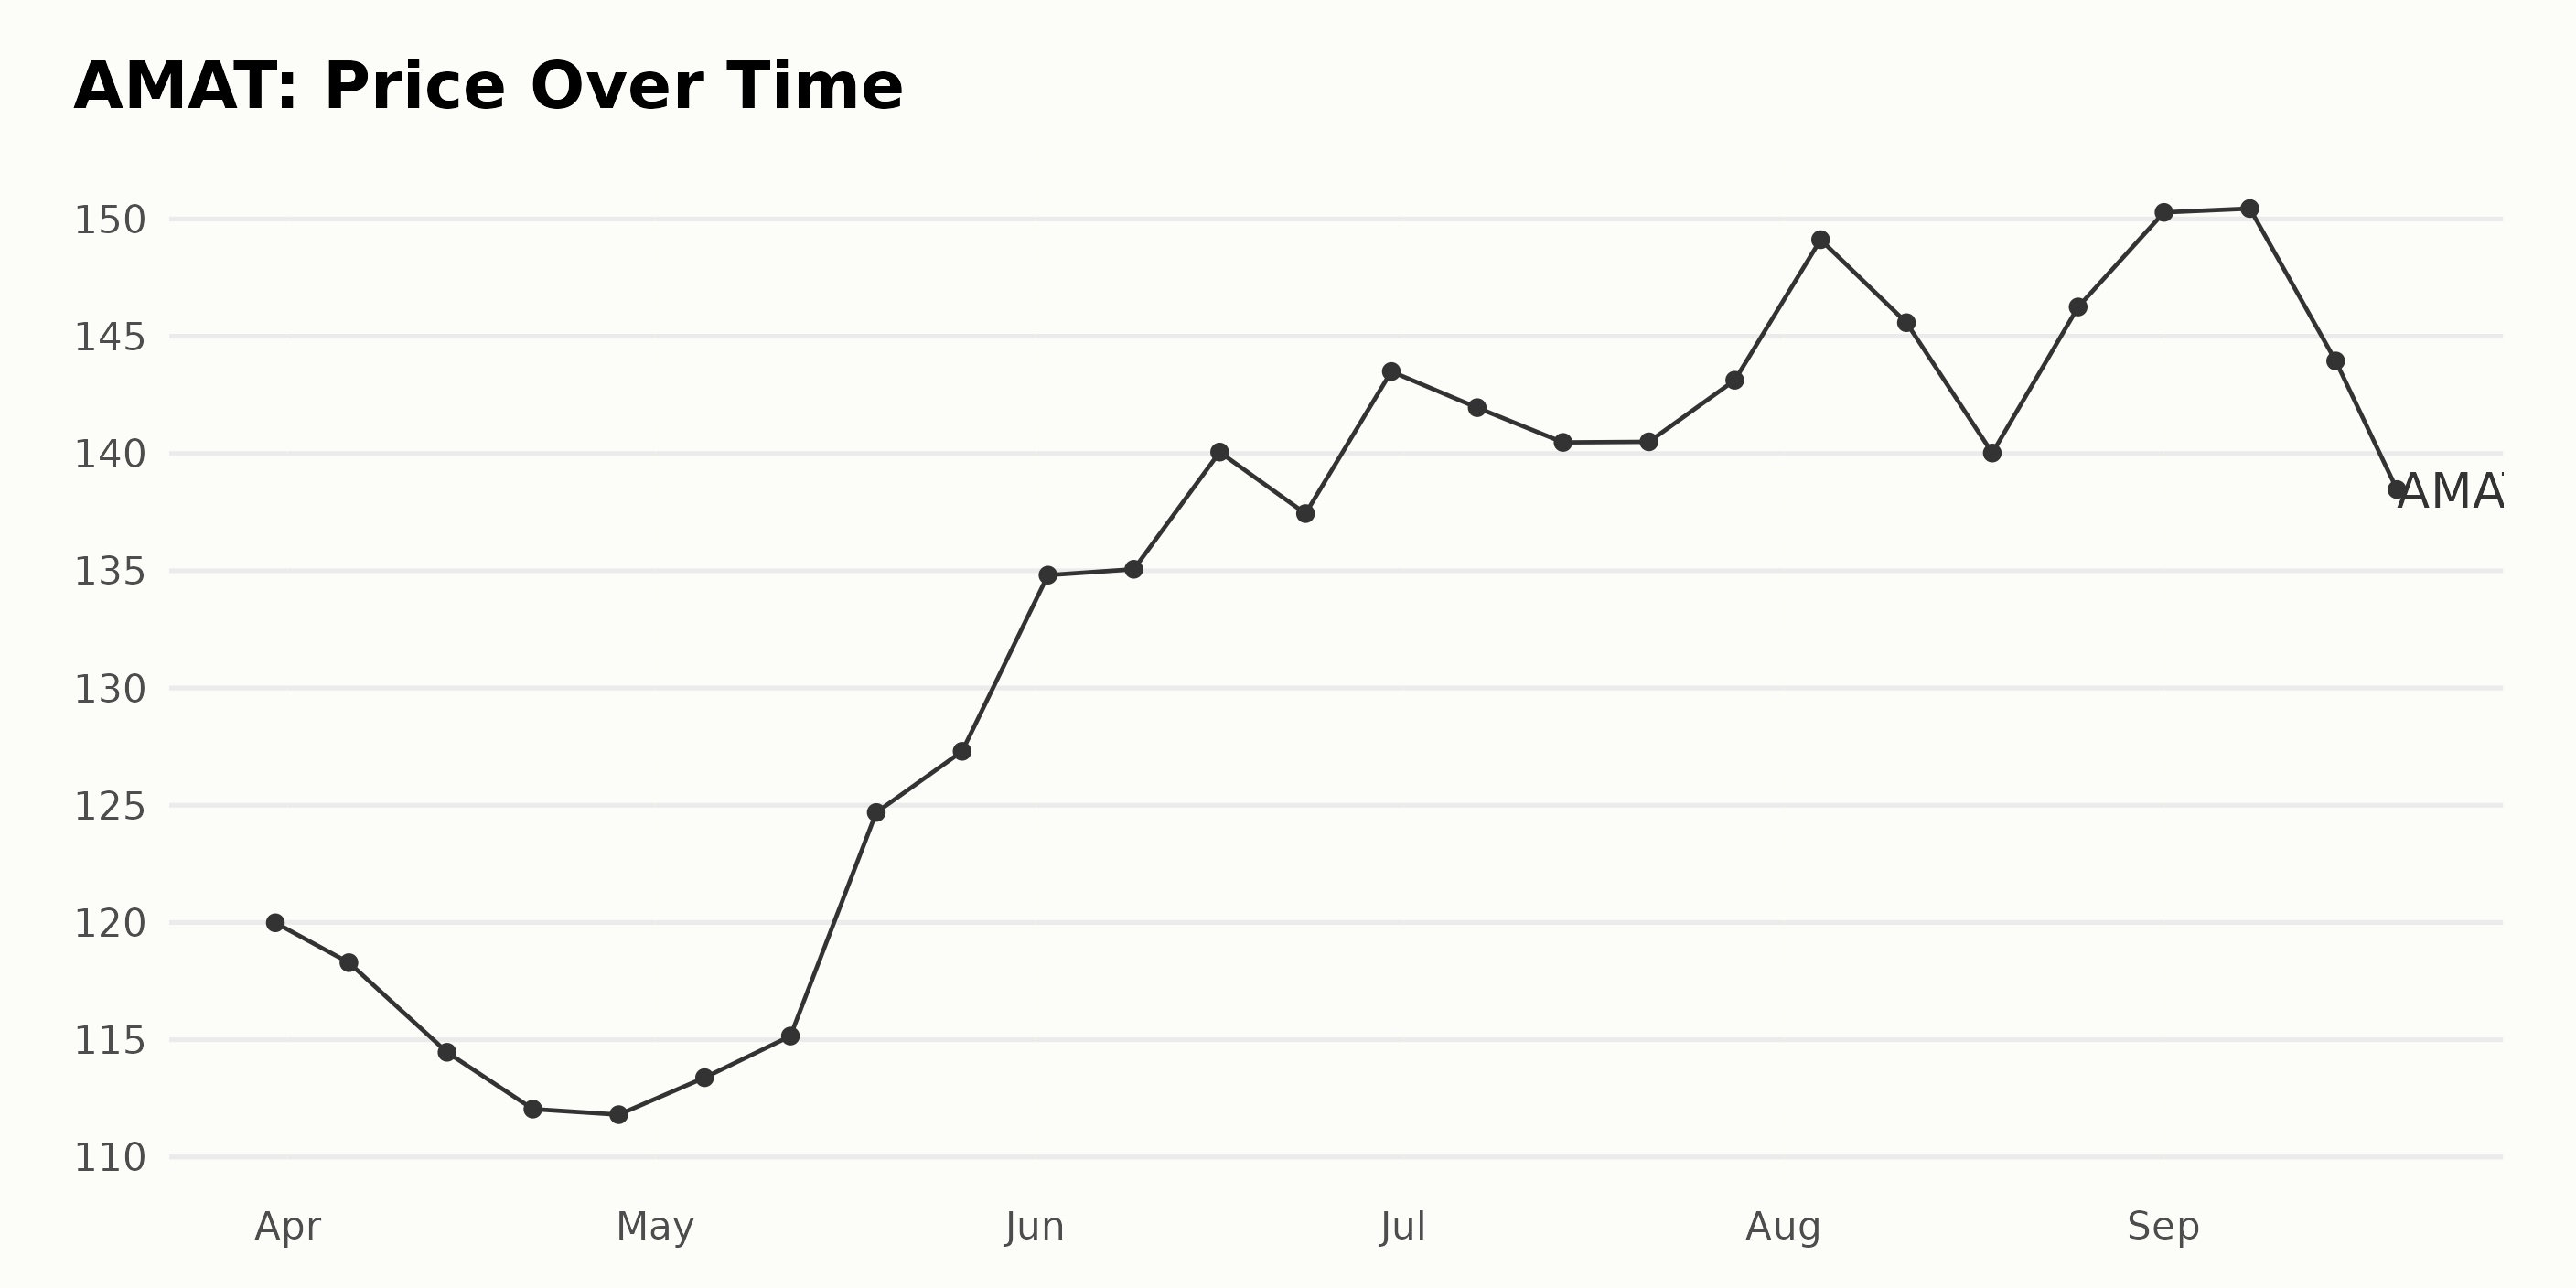
Analyzing Applied Materials Inc.’s Share Price Volatility from March to September 2023
The share price of AMAT demonstrates a general upward trend from March to September 2023, with some noticeable fluctuations.
- On March 31, 2023, the share price started at $119.99.
- There was a marked downswing until the end of April, precipitating a low of $111.81 on April 28, 2023.
- The price started recovering in May, with a notable rise to $124.69 by May 19, 2023.
- June saw continued growth with a temporary plateau around $135.06 during the week of June 9, 2023, before jumping to $140.06 on June 16, 2023.
- The price fluctuates in the $140 range throughout July. The month ends at $143.12 on July 28, 2023.
- In August, there is a slight increase and then a drop once more in mid-August, hitting $140.02 on August 18, 2023. This dip was quickly followed by another rise, closing the month at $146.25 on August 25, 2023.
- By the start of September, prices reached a high of $150.44 on September 8, 2023. However, this was followed by a decrease, and by September 21, 2023, the price had dropped to $135.19.
The data exhibits an overall growth trend, concluding in a higher position than where it began. However, the rate of growth isn’t consistent. It shows signs of rapid acceleration until mid-May, followed by deceleration and then another quick acceleration in early June. A relatively stable period transpired throughout July. There was a brief acceleration in early August, followed by a deceleration toward the end of September, suggesting volatility within the investigated timeframe. Here is a chart of AMAT’s price over the past 180 days.
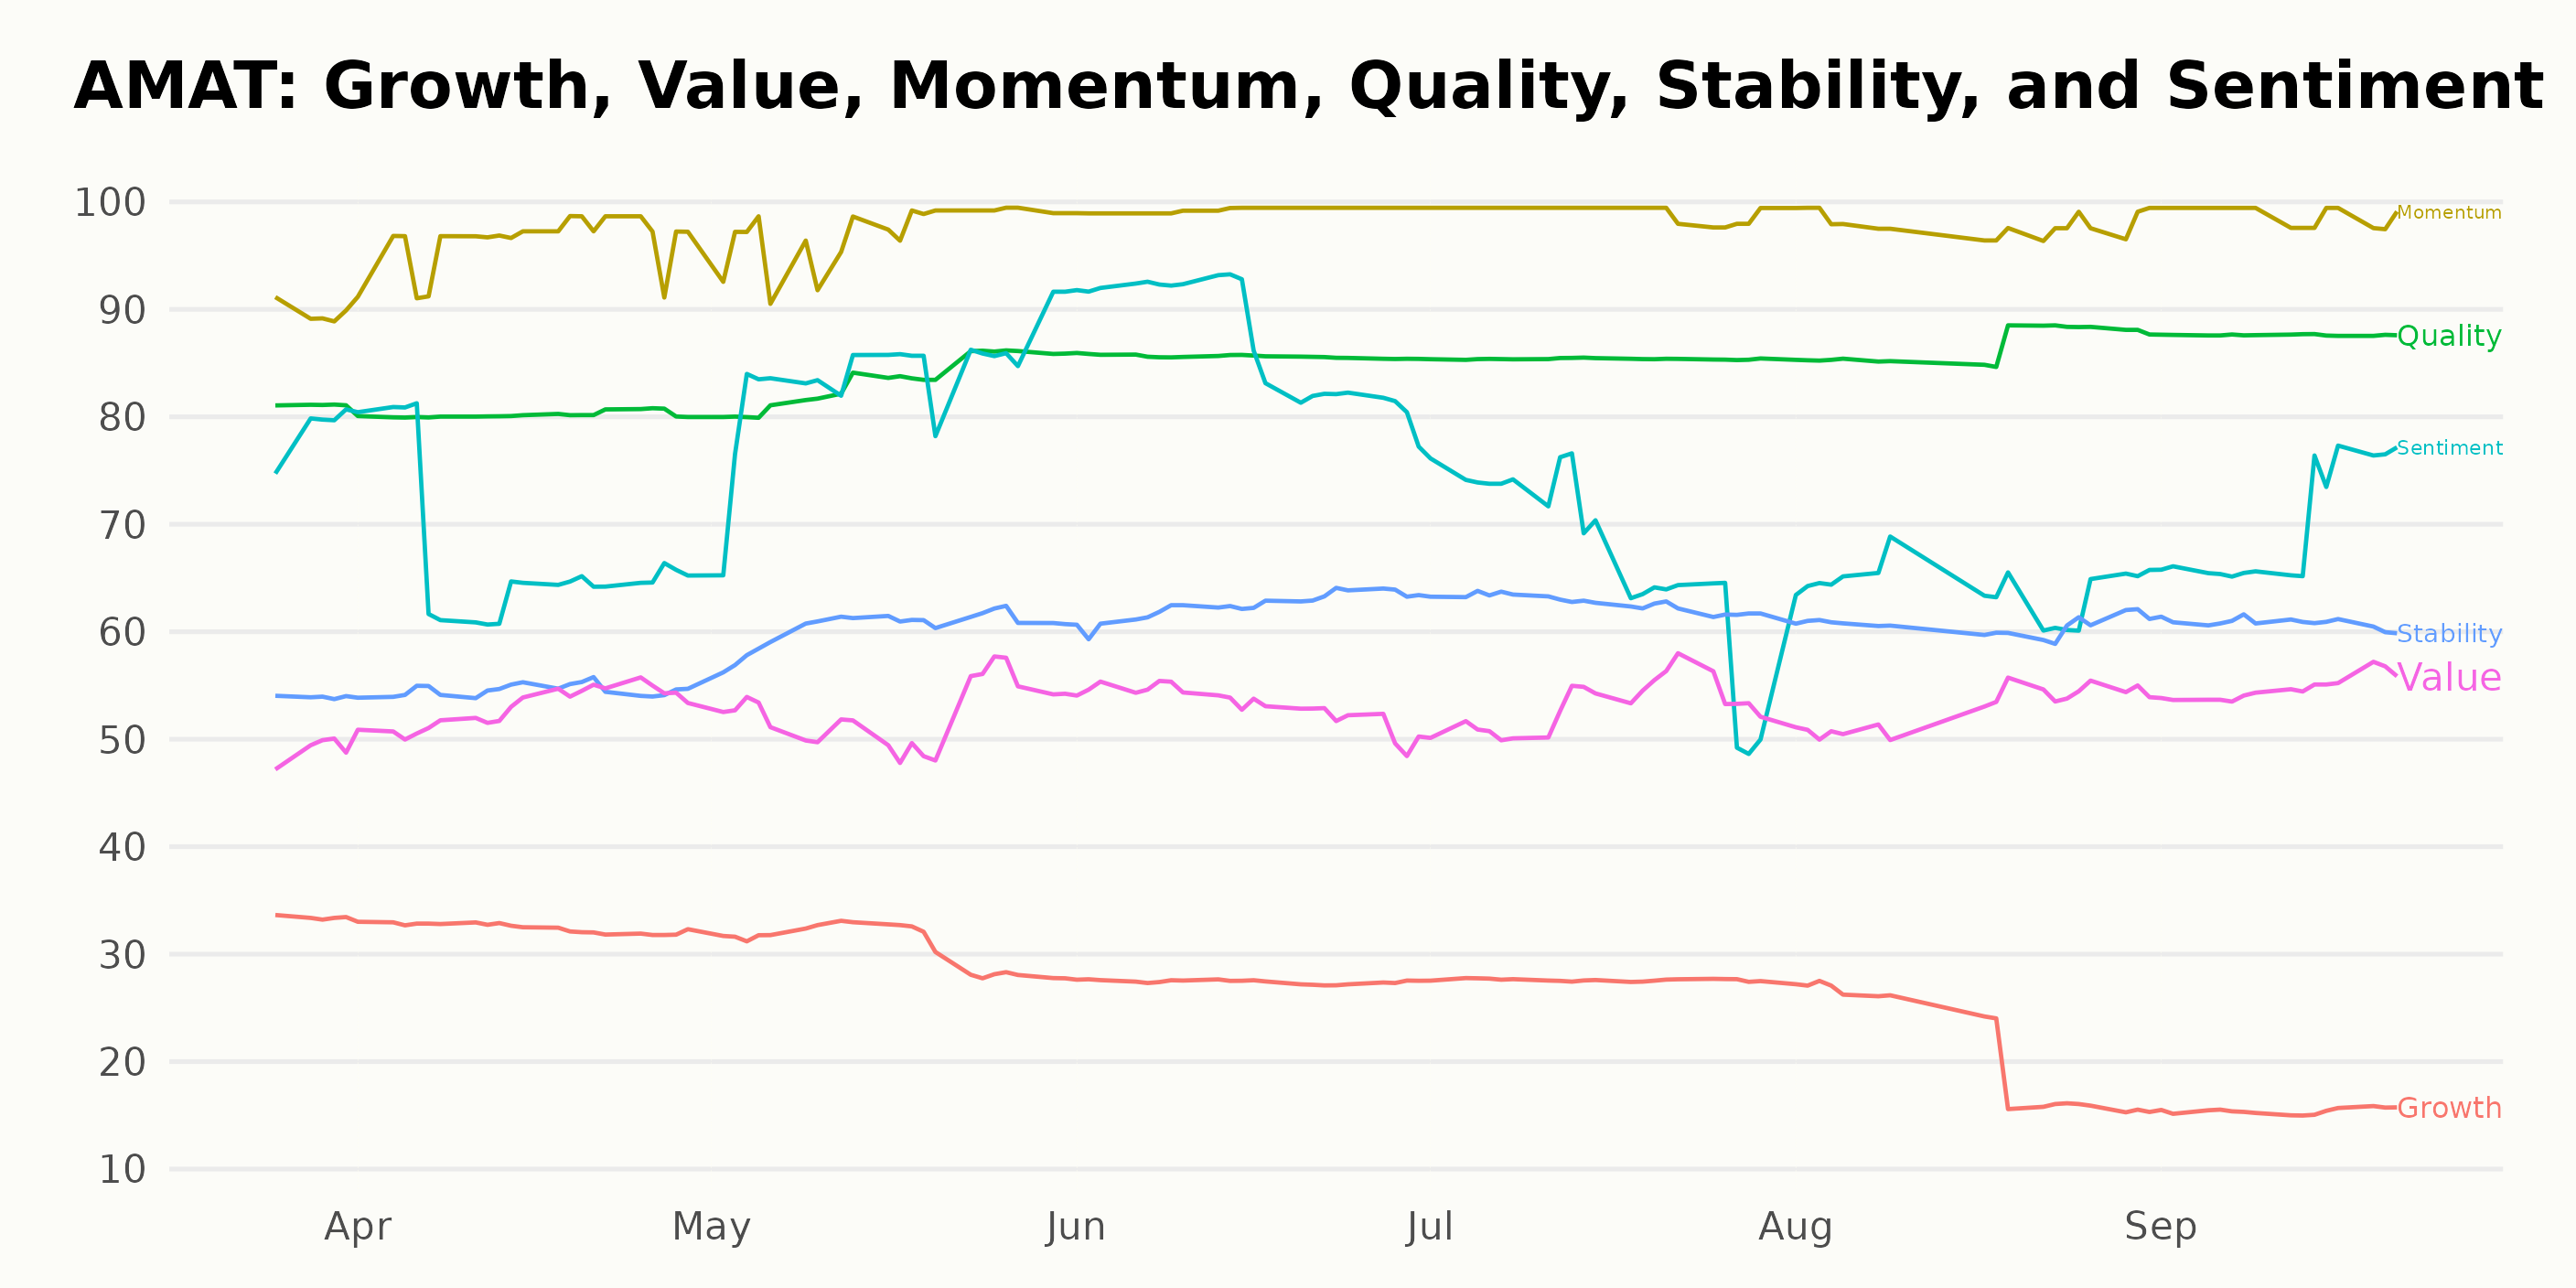
Assessing Key POWR Ratings Dimensions of Applied Materials Inc. Over Time
AMAT has an overall B rating, translating to a Buy in our POWR Ratings system. It is ranked #9 out of the 92 stocks in the Semiconductor & Wireless Chip category.
The POWR Ratings for Applied Materials Inc. (AMAT) shows noteworthy elements in three key dimensions - Momentum, Quality, and Sentiment. Below, we’ll be delving deeper into these identified aspects.
Momentum: This dimension has consistently shown high ratings over several months.
- In March 2023, its value stood at 90.
- In by April 2023, a clear upside momentum was noticeable, with an impressive score of 96.
- Its rating peaked at 99 in June and July 2023, maintaining this trend through to September of the same year.
Quality: Quality also demonstrated strong performance across the tracked period.
- In March 2023, ‘Quality’ was rated at 81.
- By June 2023, the dimension saw a positive increase, attaining a score of 86.
- Its value further climbed to 88 by September 2023, indicating a consistent upward move.
Sentiment: In comparison to the above two dimensions, ‘Sentiment’ displayed some volatility but retains significant importance.
- Starting at 79 in March 2023, it reached 84 by May 2023.
- However, there was a decrease witnessed in July and August 2023, where it fell to 67 and 64 respectively.
- By September 2023, Sentiment showed signs of recovery with a rating of 70.
From these observations, AMAT has demonstrated strong Momentum and Quality over time, while Sentiment, although displaying more fluctuation, remains an important dimension to watch.
How does Applied Materials Inc. (AMAT) Stack Up Against its Peers?
Other stocks in the Semiconductor & Wireless Chip sector that may be worth considering are Renesas Electronics Corporation (RNECF), Everspin Technologies Inc. (MRAM), and STMicroelectronics N.V. (STM) -- they have better POWR Ratings.
What To Do Next?
Discover 10 widely held stocks that our proprietary model shows have tremendous downside potential. Please make sure none of these “death trap” stocks are lurking in your portfolio:
AMAT shares were trading at $137.13 per share on Friday afternoon, up $1.94 (+1.44%). Year-to-date, AMAT has gained 41.82%, versus a 14.11% rise in the benchmark S&P 500 index during the same period.
About the Author: Subhasree Kar

Subhasree’s keen interest in financial instruments led her to pursue a career as an investment analyst. After earning a Master’s degree in Economics, she gained knowledge of equity research and portfolio management at Finlatics.
Evaluating Applied Materials (AMAT) as a Smart Investment Opportunity StockNews.com