Dogecoin (CRYPTO: DOGE) fell to just above the 13-cent level at 10 p.m. on Thursday but on Friday morning the crypto began to bounce up from the level.
The slight decline didn’t negate the uptrend that Dogecoin has been trading in since March 15, and may serve as the next higher low in the pattern.
An uptrend occurs when a stock consistently makes a series of higher highs and higher lows on the chart.
The higher highs indicate the bulls are in control while the intermittent higher lows indicate consolidation periods. Traders can use moving averages to help identify an uptrend with rising lower timeframe moving averages (such as the eight-day or 21-day exponential moving averages) indicating the stock is in a steep shorter-term uptrend and rising longer-term moving averages (such as the 200-day simple moving average) indicating a long-term uptrend.
A stock often signals when the higher high is in by printing a reversal candlestick such as a doji, bearish engulfing or hanging man candlestick. Likewise, the higher low could be signaled when a doji, morning star or hammer candlestick is printed. Moreover, the higher highs and higher lows often take place at resistance and support levels.
Want direct analysis? Find me in the BZ Pro lounge! Click here for a free trial.
In an uptrend the "trend is your friend" until it’s not and in an uptrend there are ways for both bullish and bearish traders to participate in the stock:
- Bullish traders who are already holding a position in a stock can feel confident the uptrend will continue unless the stock makes a lower low. Traders looking to take a position in a stock trading in an uptrend can usually find the safest entry on the higher low.
- Bearish traders can enter the trade on the higher high and exit on the pullback. These traders can also enter when the uptrend breaks and the stock makes a lower low indicating a reversal into a downtrend may be in the cards.
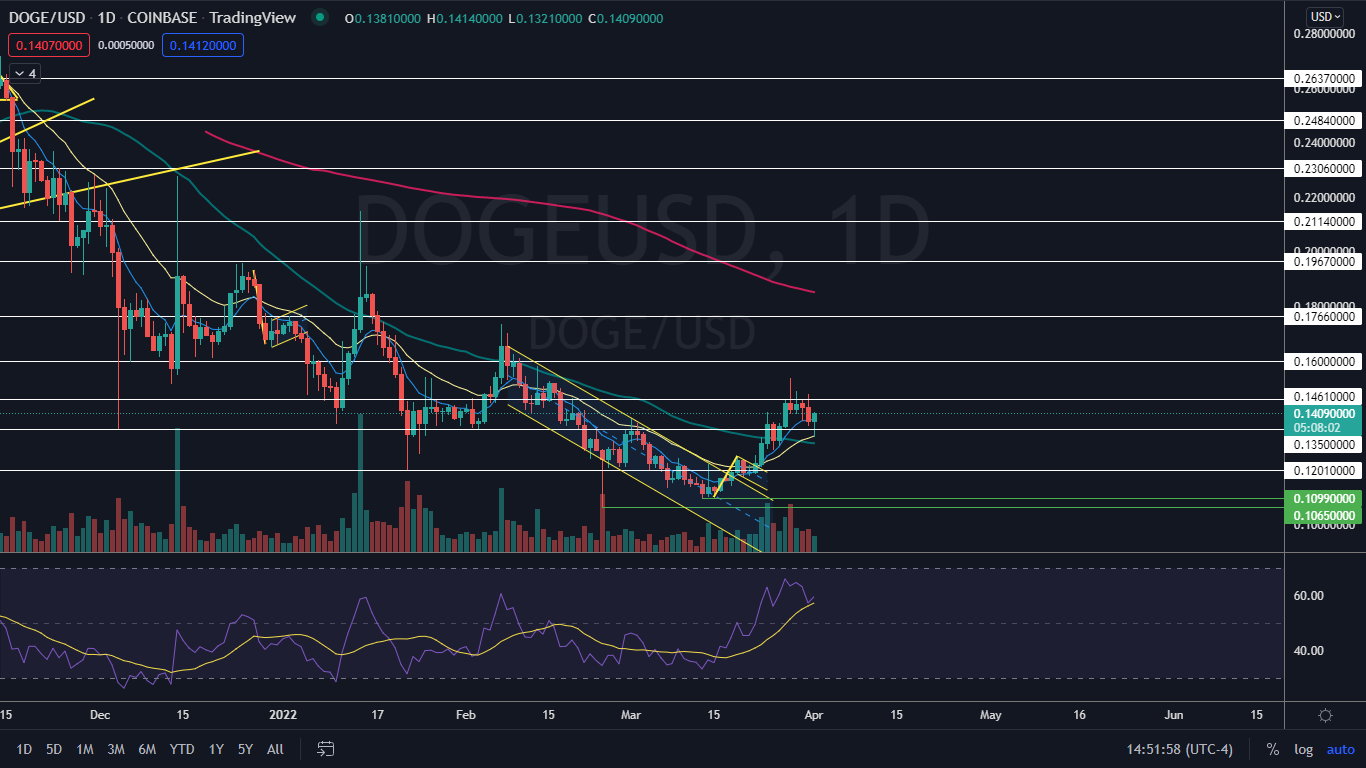
The Dogecoin Chart: Dogecoin reversed into an uptrend on March 15 after printing a triple bottom pattern at the $0.109 level on that day and the two 24-hour trading sessions prior. Since then, Dogecoin has been trading in a strong uptrend with the most recent confirmed higher low created on March 25 and $0.127 and the most recent higher high formed at the $0.153 level on March 28.
- If Dogecoin closes the 24-hour session near its high-of-day, the crypto will print a hammer candlestick on the daily chart, which could indicate higher prices will come again on Saturday. The crypto could also see higher prices over the weekend if it closes the trading day flat, which would cause Dogecoin to print a doji candlestick.
- When Dogecoin dipped lower late Thursday evening, it tested support at the 21-day exponential moving average and wicked up from the level. The crypto then regained support at the eight-day EMA, which caused the eight-day EMA to remain trending above the 21-day and is a bullish indicator.
- If the crypto falls below the March 28 low-of-day, the uptrend will be negated, at which point Dogecoin is likely to enter into a downtrend.
- Dogecoin has resistance above at $0.146 and 16 cents and support below at $0.135 and the 12-cent mark.