When you look at all publicly traded securities listed on major U.S. exchanges, the number probably stands somewhere around 6,000. Whatever the actual figure is, it’s impossible for investors to conduct thorough research on each and every name. Sometimes, you need to quickly separate the wheat from the chaff — and that’s where Barchart Screeners comes into play.
Among the lesser-known platform tools that I like to use is Barchart’s Three-Day Losers. My thinking is that the screener tends to capture generally robust enterprises that got caught temporarily in rough circumstances. On the other end, it might not be the wisest idea to consider 52-week losers because there might be a reason why a company has struggled for that long.
Of course, merely looking at cheapened names isn’t going to cut it. A rationale must exist to pick one idea over others. Based on quantitative evidence, I firmly believe that Strategy Inc (MSTR) is a prime candidate for a sentiment reversal.
On Thursday, MSTR stock landed on the aforementioned Three-Day Losers list, courtesy of losing 1.18% since Monday’s close. To be sure, this level of underperformance doesn’t sound like much. However, with Strategy essentially being a proxy for the cryptocurrency sector, MSTR can be incredibly kinetic. In the trailing year, it’s up over 149%.
Put another way, the red ink could represent a tempting opportunity for bullish speculators. Of course, a 1% drop isn’t the only reason to consider MSTR stock — far from it.
MSTR Stock Flashes a Potential Reversal Signal
While most financial articles will attempt to deep-dive the underlying fundamentals of Strategy, I’m operating under the (reasonable) presupposition that the price of MSTR stock has already incorporated all publicly available evidence. Therefore, it’s much more important to consider the patterns of behavior tied to MSTR’s market action.
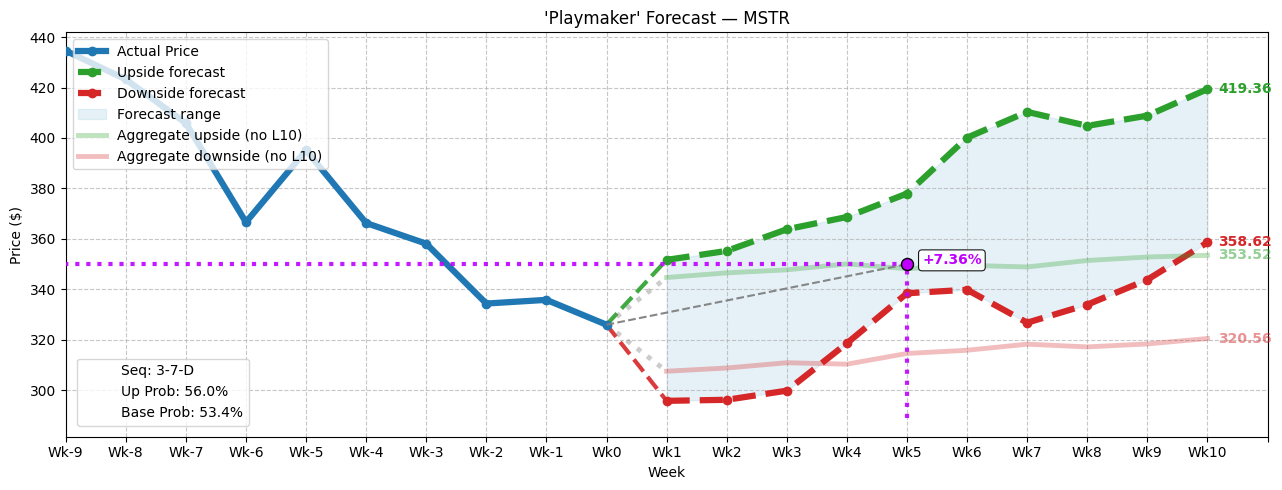
As such, from a quantitative perspective, Strategy is currently structured in a distribution-heavy environment. In the trailing 10 weeks, MSTR stock has printed only three up weeks against seven down weeks, leading to an overall downward trajectory. For classification purposes, we can label this sequence as 3-7-D.
With a falsifiable signal, we can now look back at historical data to determine how the market usually responds to the 3-7-D sequence. From my in-sample dataset (which runs from January 2019 to July 2025), the sequence has only flashed 25 times on a rolling basis. Further, in the first week, the chance of upside is modest, about 56%.
However, over the next several weeks, the expected drift from the 3-7-D tends to drift northward relative to the aggregate or baseline drift. Bullish traders may anticipate a range between a median low of $358.62 to a median high of $419.36. In contrast, the baseline drift calls for a range between $320.56 to $353.52.
That’s one major reason why traders should keep close tabs on MSTR stock: market makers are likely pricing options to reflect the baseline expectations rather than the elevated range historically resultant from the 3-7-D sequence.
However, we also need to control for exogenous factors that could be providing a false bullish signal. Therefore, I ran an out-of-sample test isolating the expected risk-reward profile of the 3-7-D relative to the sentiment regime between January 2022 and December 2023.
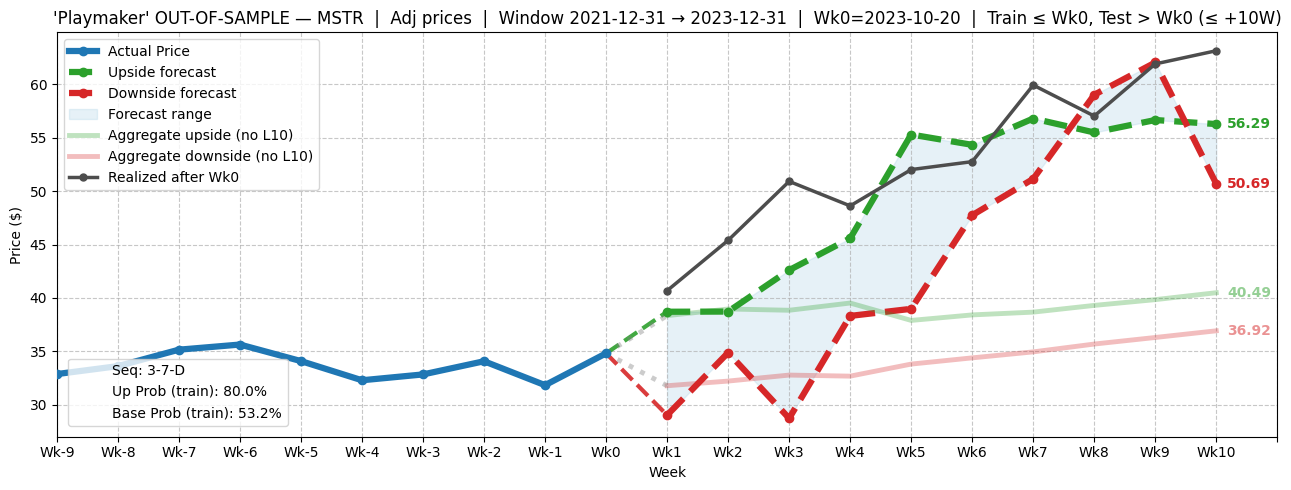
This period was before the big run-up in cryptos that sent MSTR stock soaring, thus giving us a better idea of how the sequence performs in non-euphoric environments. As it turns out, the out-of-sample test also reveals a strong uptrend a few weeks after the flashing of the signal.
To me, this is statistical evidence that MSTR stock is a name well worth watching.
Buying the Strategy Dip
Using the market intelligence above, the one trade that arguably stands out the most is the 345/350 bull call spread expiring Oct. 17. This transaction involves buying the $345 call and simultaneously selling the $350 call, for a net debit paid of $205 (the most that can be lost in the trade).
Should MSTR stock rise through the second-leg strike price ($350) at expiration, the maximum profit is $295, translating to a payout of nearly 144%. Breakeven lands at $347.05.
Mainly, this call spread is tempting because the implications of the 3-7-D sequence should quite easily make the $350 target quite reasonable. In fact, there might be a case for the most extreme speculators to push the second leg strike to $380. But because anything can happen in the market, being more probabilistically conservative is smarter.
Besides, for a relatively conservative trade, there’s a big triple-digit percentage payout available. You’re not going to find that too often, which is why I’m calling attention to MSTR stock.
On the date of publication, Josh Enomoto did not have (either directly or indirectly) positions in any of the securities mentioned in this article. All information and data in this article is solely for informational purposes. For more information please view the Barchart Disclosure Policy here.