
Back in late April, John Rowland, CMT, flagged a V-bottom in the S&P 500 ($SPX) and projected an upper-level target near $668 on the SPDR S&P 500 ETF (SPY). Right now, price is basically there — within a point of his objective.
During last Friday’s Market on Close, John walked through what he’s seeing now: why V-bottoms can grind higher in a “methodical rise,” how to think about triple-witching energy at targets, and which indicators suggest either continuation or a pause.
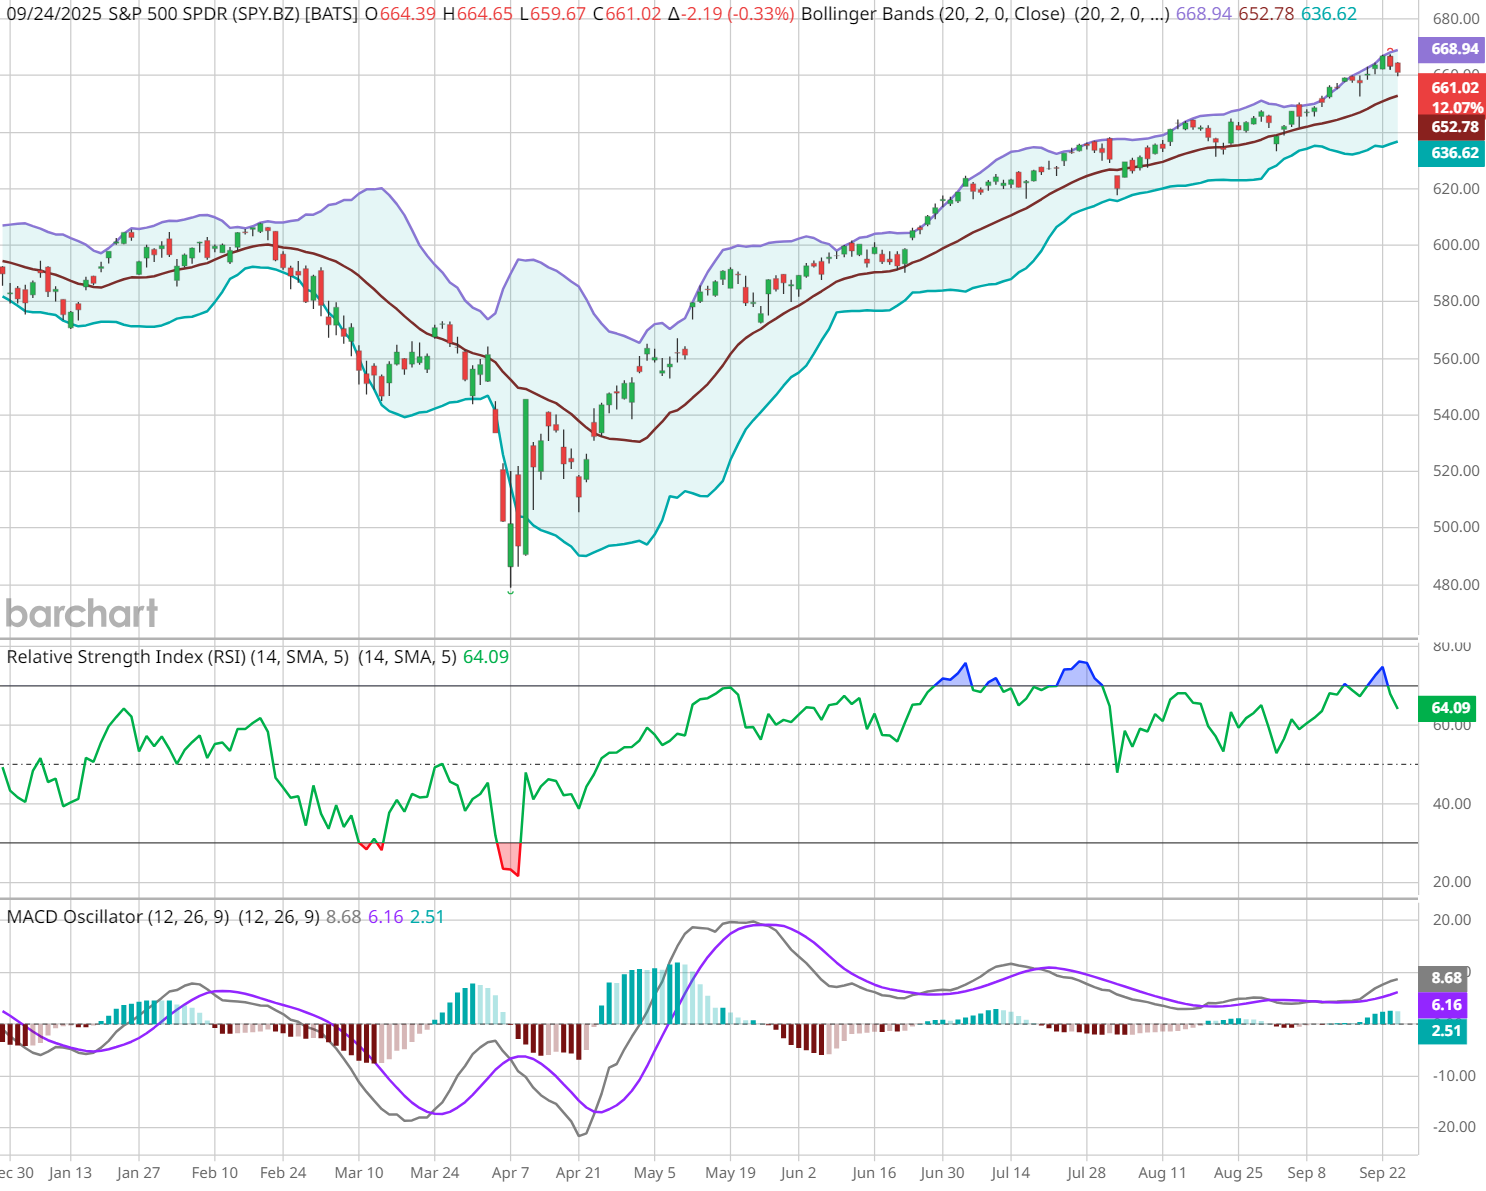
Why The $668 Area Matters
- Measured move logic: After a V-bottom recaptures the origin of the selloff, John extrapolates trough → peak to project an upside objective. That math lands ~$668 on SPY.
- Time/positioning: Approaching targets into triple-witching options expiration often injects hedging/roll flows that can amplify short-term swings. Hence, the push higher in stocks last week.
What John’s Watching Now
- RSI divergence (daily): Price made a higher high while Relative Strength Index (RSI) made a lower high → negative divergence that often precedes digestion.
- RSI (weekly): Not overbought on weekly, so the bigger trend isn’t screaming “exhausted.”
- Bollinger Bands (daily): Price is tagging the upper band. Classic reading: markets can “ride the band,” but stretches above it frequently mean-revert.
- MACD (daily): Momentum still positive, but a flattening or cross after divergence would confirm a pause.
Trade Plan Ideas (Education, Not Advice)
Scenario A – Upside continuation:
What to see: Daily RSI re-accelerates, MACD expands, closes above the upper Bollinger band follow through (no immediate reversal).
How to track it on Barchart:
- SPY Interactive Chart → add RSI, MACD, Bollinger Bands.
- Seasonality → Compare VIX & SPY for typical returns during Sept-Nov.
- Expected Move → probability rails for weekly ranges.
Scenario B – Digest/mean-revert pullback:
What to see: Failure to hold break above the band, RSI divergence persists, daily MACD rolls.
How to track it on Barchart:
- Trader’s Cheat Sheet → next blue (support) / red (resistance) levels for the session.
- Gamma Exposure (GEX) → see if negative gamma zones could amplify swings.
- Economic Calendar → catalysts that could trigger the pullback window.
Watch, Learn, Act
Watch the clip as John explains the V-bottom target and why divergences matter at inflection points:
- Stream the full episode: More context on price targets, market sectors, and positioning.
- Turn on notifications so you catch the next live Market on Close right as setups evolve.