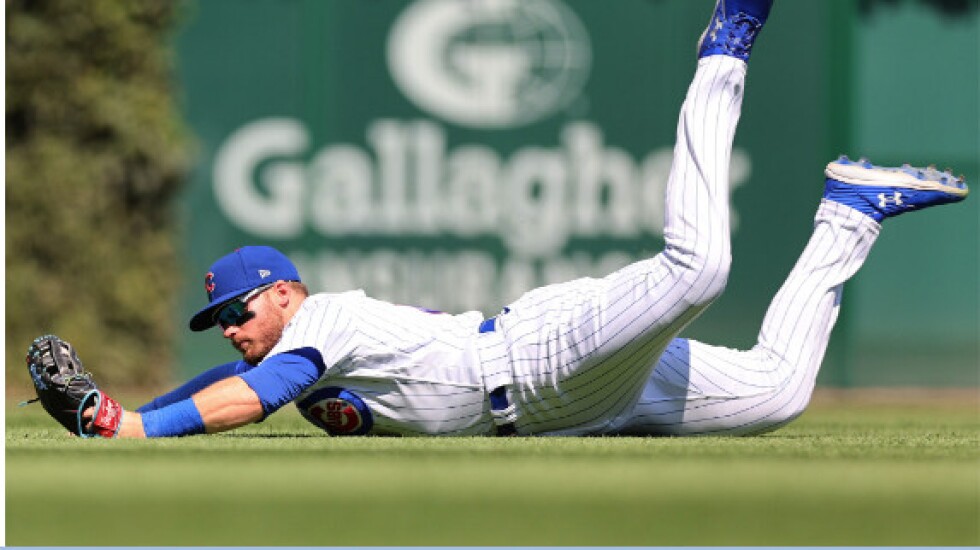
As Chicago’s only Gold Glove winner last year, the Cubs’ Ian Happ led National League left fielders with 13 defensive runs saved and a 1.0 defensive WAR, as calculated at Baseball-Reference.com.
Teammate Nico Hoerner had two fewer runs saved but nearly three times the dWAR at 2.9.
What gives?
Hoerner played shortstop last season. Shortstops make more plays and a greater number of difficult plays than left fielders. If you were forced to go with one good defender and one weak defender at the two positions, you’d want the better one at short.
Positional adjustments are made. Per 1,350 innings, Baseball-Reference adds nine runs for catchers, seven for shortstops, three for second basemen, 2.5 for center fielders and two for third basemen. It subtracts seven each for left and right fielders, 9.5 for first basemen and 15 for designated hitters.
The negative numbers are necessary for wins above replacement to reflect team victories accurately. If 15 runs were added to every position so DH was zero and catchers 24, the difference among positions would be the same. But that would attribute too many runs to defense and lead to team victory estimates that would be too high.
Fangraphs uses a similar method. Per 1,458 innings, it adds 12.5 runs for catchers, 7.5 for shortstops and 2.5 each for second basemen, third basemen and center fielders. It subtracts 7.5 each for left and right fielders, 12.5 for first basemen and 17.5 for DHs.
But Fangraphs doesn’t compute a defensive WAR separately from overall WAR. It lists offensive, baserunning and fielding runs as its WAR components.
Baseball-Reference does list dWAR, and it can feel wrong to those not used to the numbers. About two-thirds of the way through last season, every regular left fielder was on the negative side of dWAR, even those with positive runs saved.
Runs saved starts at zero. Anyone on the positive side has saved more runs than an average player at his position.
So how can a fielder who’s better than average for his position also be WAR-negative compared to a replacement-level player? It’s because dWAR compares the player to defenders at all positions, not just his own. The purpose is to put players with differing positions and responsibilities on the same scale for overall WAR.
A left fielder with a 3.0 WAR has the same value as a shortstop with a 3.0 WAR, but to get to that equality, the left fielder has to hit more to overcome the difference in defensive value.
In Happ’s case, Baseball-Reference listed him with 4.4 WAR in 2022, the same as Hoerner. But Happ got there with a .781 OPS and 119 OPS+ that topped Hoerner’s .736 and 107. Hoerner’s defensive position boosted him into the WAR tie.
Because of the position deductions, a corner outfielder or first baseman has to be a really good defender to reach positive numbers in Baseball-Reference’s dWAR or Fangraphs’ defensive runs. That might feel wrong, but the negatives are necessary if WAR is to correlate well with victories.