
I concluded my Q2 Barchart report on base metals with the following:
As the base metals market enters the second half of 2025, copper, the leading base metal, was marginally above $5 per pound until July 8, when the COMEX futures price exploded to a new record high. Most LME stocks have declined from the end of 2024, and the overall trend since the 2020 pandemic-inspired low remains higher. However, the Chinese economy and U.S. tariffs are the critical factors that could determine the path of least resistance of prices over the coming months. Keep an eye on LME stockpiles as they can provide significant fundamental clues that will impact the price direction.
Q3 was very volatile, led by wild price swings in copper and a massive divergence between COMEX and LME copper prices as metal flowed from LME warehouses to COMEX warehouses. Trade issues were in the spotlight for many commodities, and base metals were no exception.
COMEX Copper versus LME Copper Q3
Copper wound up in the crosshairs of the U.S. tariff policy in 2025, causing the metal to flow from LME to COMEX warehouses. COMEX copper futures prices reached two all-time highs in 2025, in March and July, while the LME forwards remained below the 2024 peak.
In Q3, COMEX copper futures declined by 3.45% while the LME copper three-month forwards gained 4.05%. The unprecedented premium for COMEX over LME copper prices narrowed after the futures plunged from a record high of nearly $6 to below $4.35 per pound in July.
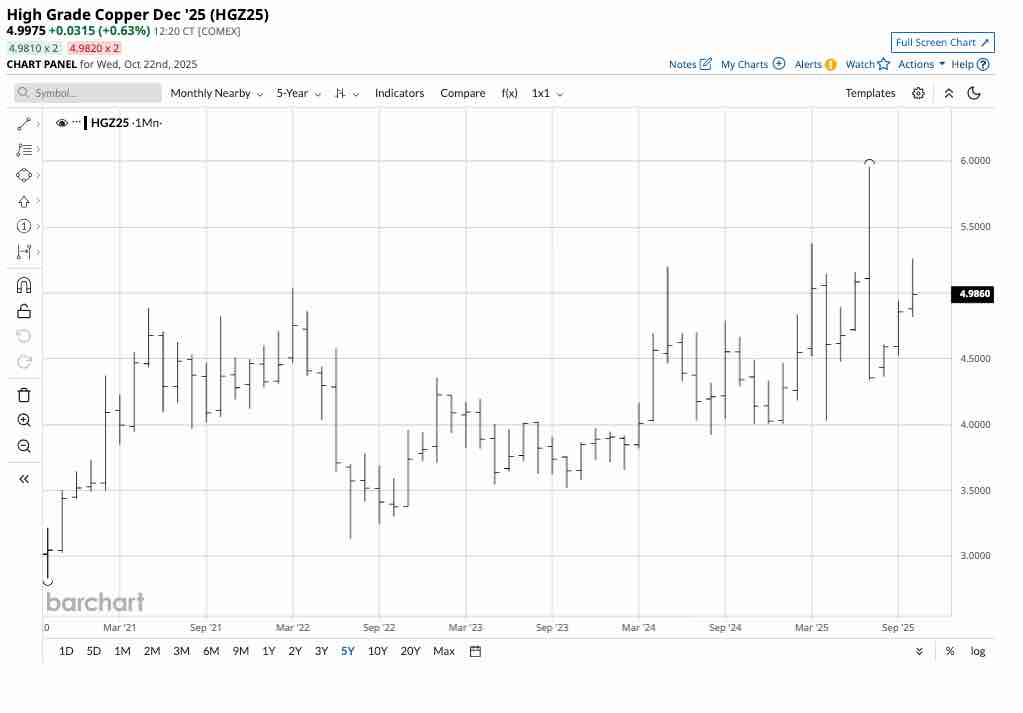
The monthly futures chart highlights the substantial price swings between just over $4 and just under $6 per pound over the first nine months of this year. COMEX copper futures moved 20.61% higher from the end of 2024 through September 30, 2025, when they settled at $4.8565 per pound.
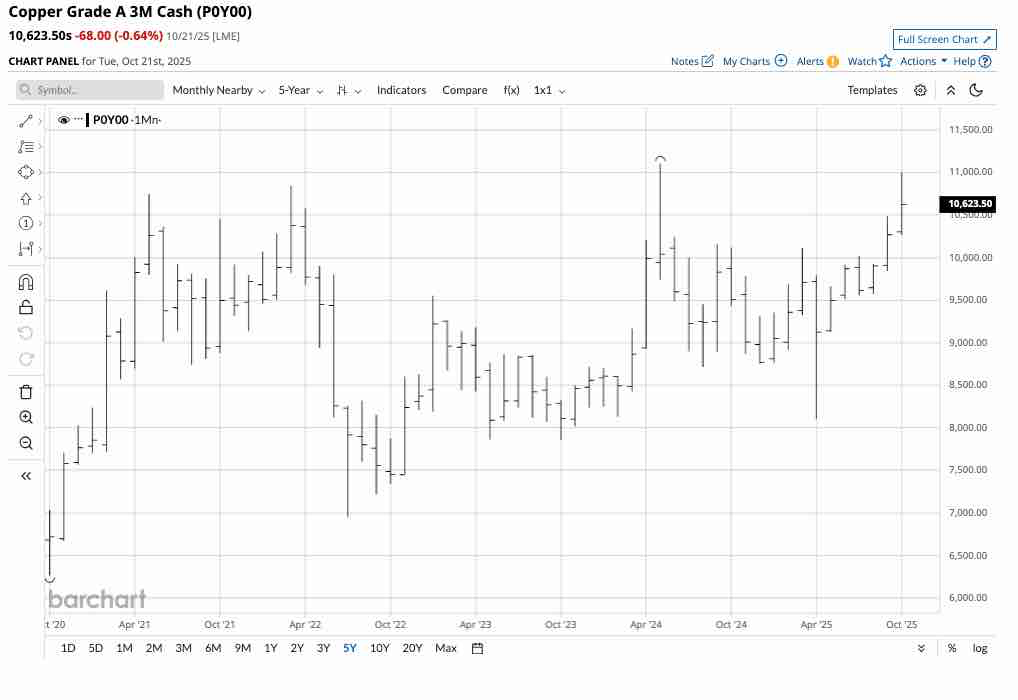
The monthly chart of LME three-month copper forwards illustrated that while the industrial metal remained below the 2024 all-time high of $11,104.50 per metric ton, copper forwards gained 17.11% over the first three quarters, settling Q3 at $10,268.50 per ton.
The LME forwards and COMEX futures were higher than the Q3 closing prices in October, and the spread between the futures and forwards has returned to more normal levels since the COMEX futures rose to the latest record peak in July.
LME Stocks in Q3 and over the first nine months of 2025
Inventory shifts at the world’s most liquid nonferrous metals exchange provide clues about each metal’s supply-demand fundamentals. Moreover, trends across the metals can suggest the sector’s macroeconomic trends.
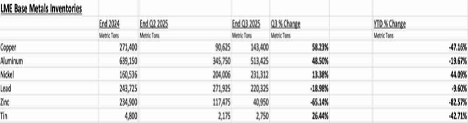
The chart illustrates that LME stockpiles of copper, aluminum, nickel, and tin posted significant increases during Q3, while lead and zinc inventories declined. However, from the end of 2024 through September 30, 2025, only nickel inventories rose, with copper, aluminum, lead, zinc, and tin posting substantial declines. The U.S. tariff policies are likely causing metals to move from LME to U.S. warehouses in many metals, while China, the world’s leading base metal consumer, is likely increasing its strategic and unpublished metal stocks.
As of October 21, 2025, LME stocks stood at the following levels:
- Copper at 137,150 tons was slightly lower than the Q3 closing level.
- Aluminum at 484,125 tons was lower than the September 30, 2025, level.
- Nickel at 250,476 tons was higher than the Q3 closing level.
- Lead at 247,300 tons declined from the level at the end of Q3.
- Zinc stocks of 37,275 tons were lower than the Q3 closing level and at the lowest level in years.
- Tin stocks of 2,735 metric tons were marginally lower than the Q3 closing level.
Watching inventory changes can provide valuable insight into supply-demand trends. However, powerful market participants can always influence perception by increasing or decreasing stock levels in the LME warehouses.
While LME copper stocks have declined in 2025, COMEX warehouse inventories have surged as metal moved into the U.S. in anticipation of trade barriers.
Zinc and tin lead on the upside in Q3
LME zinc forwards led the base metals on the upside with a gain of 7.58% in the third quarter. Tin was the second-leading base metal, moving 5.02% higher over the three-month period.
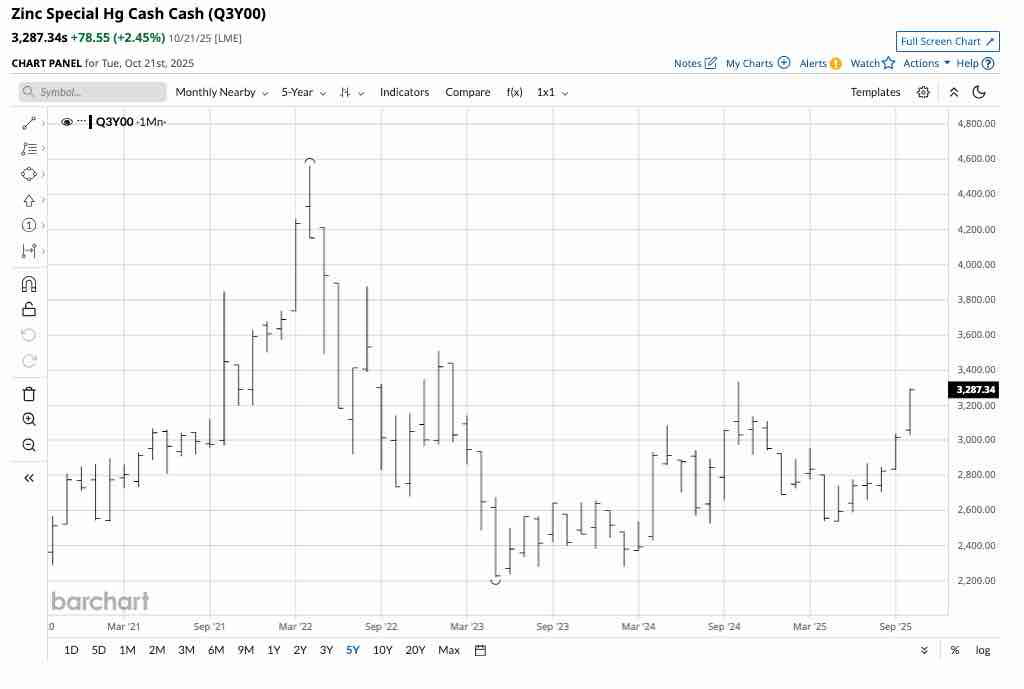
The five-year monthly chart of LME cash zinc prices shows the bullish trend since the low from May 2023. Three-month zinc forwards were higher in Q3, but moved 0.62% lower over the first nine months of 2025, settling at $2,960 per ton on September 30, 2025. Zinc prices were higher in October 2025.
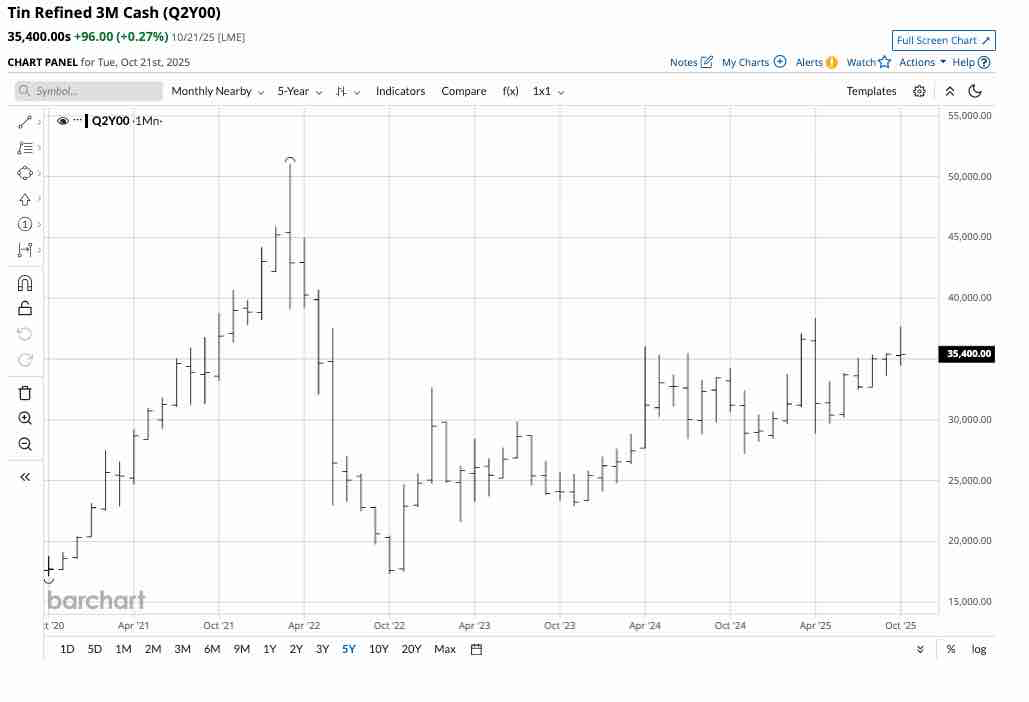
The five-year monthly chart of LME three-month tin forward prices shows the bullish trend over the past years. Three-month tin forwards were higher in Q3, and moved 21.75% higher over the first nine months of 2025, settling at $35,410 per ton on September 30, 2025. Tin was the best-performing base metal over the first three quarters. Tin was only marginally lower in October 2025.
Gains in aluminum and nickel, while lead forwards moved lower
LME aluminum and nickel posted gains, while lead forwards were lower in Q3. Aluminum forwards moved 3.20% higher in the third quarter, while nickel edged only 0.13% higher. Three-month lead forwards were the worst-performing LME base metal, moving 2.76% lower over the three-month period.
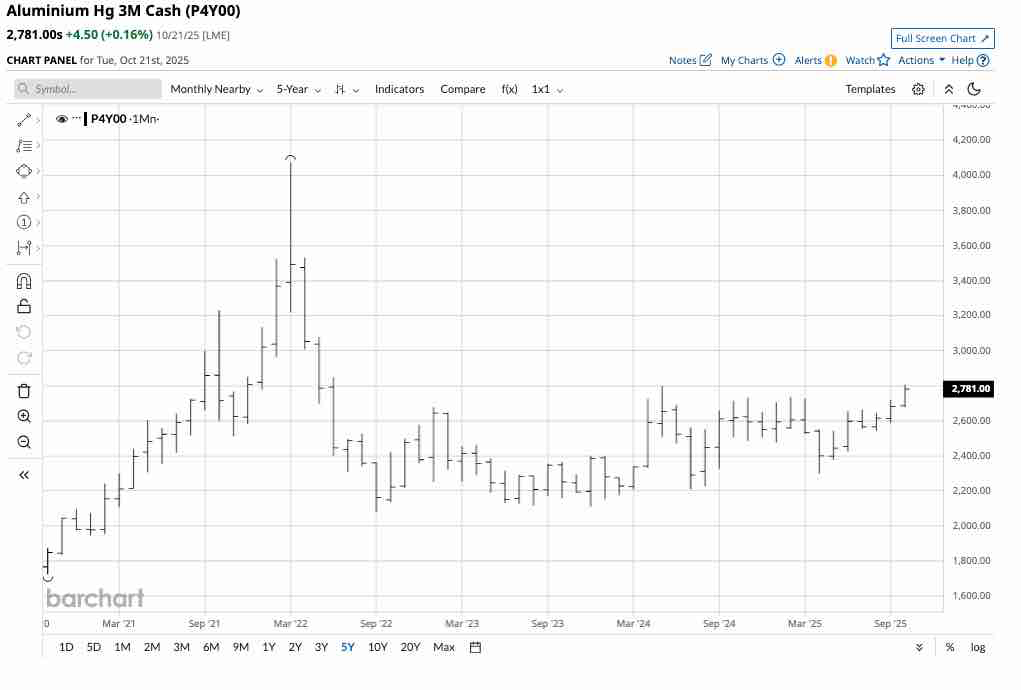
The five-year monthly chart of LME three-month aluminum prices shows a marginally bullish trend since the low in 2020. Three-month aluminum forwards moved 5.06% higher over the first nine months of 2025, settling at $2,680 per ton on September 30, 2025, and were higher in October 2025.
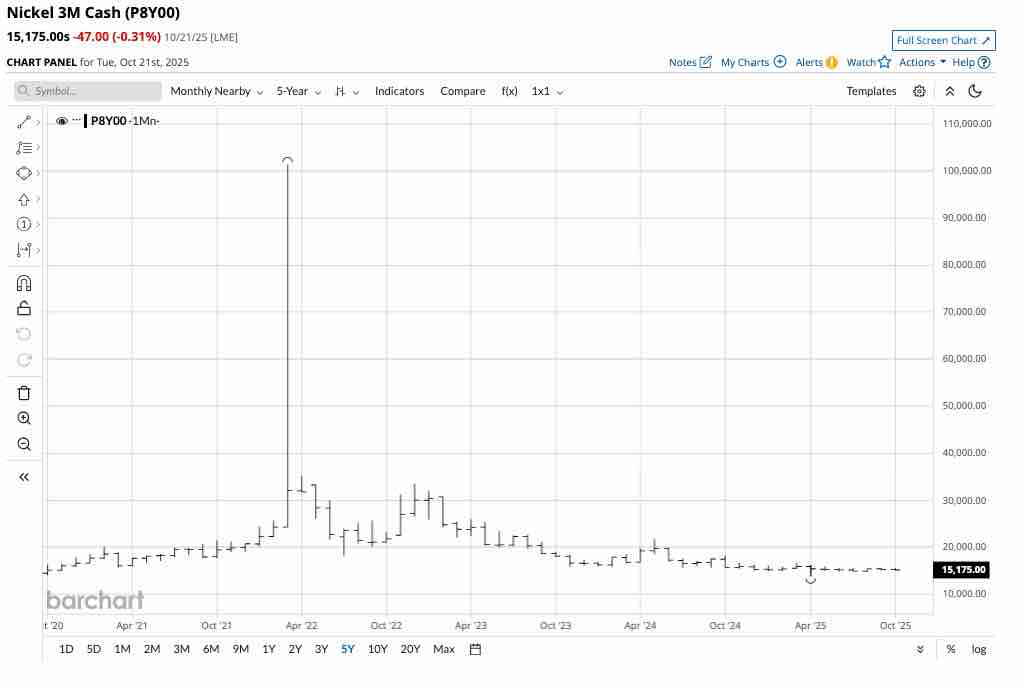
The five-year monthly chart of LME three-month nickel prices shows the 2022 price spike and a marginally bearish trend over the past years. Three-month nickel forwards moved 0.61% lower over the first nine months of 2025, settling at $15,235 per ton on September 30, 2025, and were only marginally lower in October 2025.
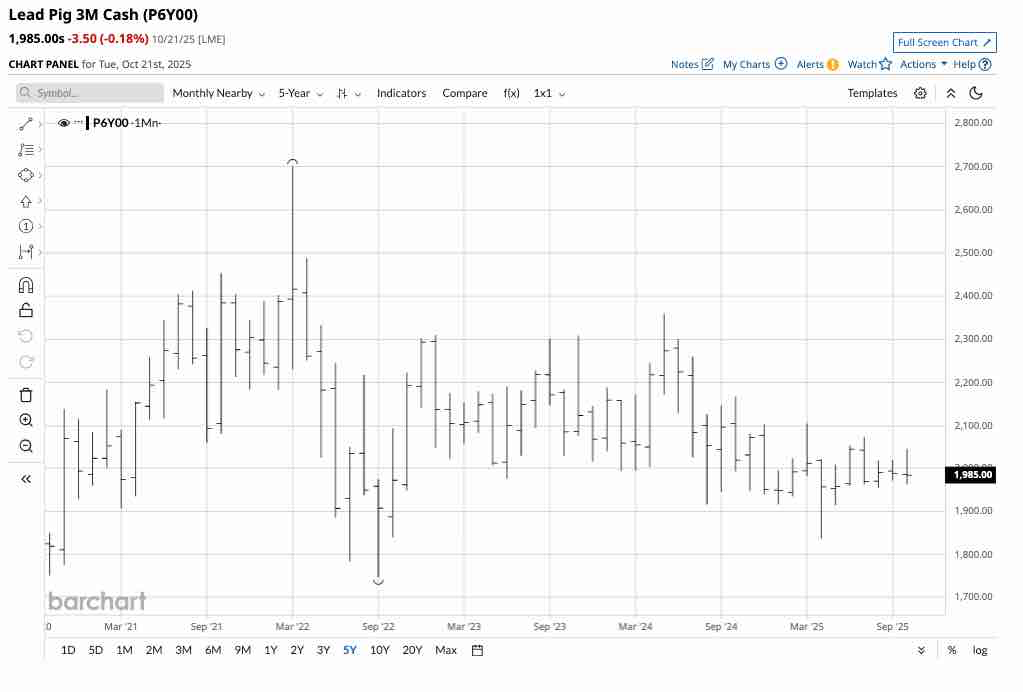
The five-year monthly chart of LME three-month lead prices shows the 2022 price spike and a marginally bearish trend over the past years. Three-month lead forwards declined in Q3, but moved 1.87% higher over the first nine months of 2025, settling at $1,988.50 per ton on September 30, 2025, and were only marginally lower in October 2025.
The prospects for Q4 and Beyond- Trade and China are critical
Base metals have remained in bullish trends since the 2020 pandemic-inspired lows. Elevated inflation increases production prices, which underpins prices as the sector heads into Q4 and 2026.
Meanwhile, U.S. trade tariffs and the Chinese economy are the most critical factors for the path of least resistance of copper, aluminum, nickel, lead, zinc, and tin prices. Watch the LME inventory levels for fundamental clues.
I remain bullish on base metals, but would only enter or add to long risk positions on price corrections in the current environment. Volatility over the past months in the COMEX copper futures could be a model for the entire sector in Q4 and 2026.