Amazon.com, Inc (NASDAQ:AMZN) was trading higher Tuesday morning after a bounce on Friday saw the stock close up 2.47%.
The e-commerce and streaming giant has traded mostly sideways over the past five trading days, showing strength compared to the S&P 500, which declined about 4% over that same time period.
On June 13, the S&P 500 officially entered into a bear market when the ETF gapped down to decline more than 20% from its Jan. 4 all-time high of $4,818.62.
Amazon, holding the third -argest weighting in the S&P 500 at 3.9%, both affects and is affected by the movements in the general markets and can be used as an indicator for short-term market direction.
Within every bear cycle, rallies to the upside take place, which can be both strong and intense as FOMO (fear of missing out) and short squeezes push individual stocks north quickly.
The rallies often trap retail traders, who believe the bottom may be in and subsequently enter into positions only to become tangled in the long drawdowns that eventually follow.
For short-term traders looking to scalp trades or swing positions, there’s a lot of opportunity during bull rallies so long as technical indicators are used to signal when the move higher is about to end.
In the near term, Amazon looks to be entering into a reversal to the upside due to recognition of a bullish pattern on the stock’s chart.
Want direct analysis? Find me in the BZ Pro lounge! Click here for a free trial.
The Amazon Chart: On June 14, Amazon slid to the $101 level and, combined with similar price action at that area on May 24, the stock printed a bullish double bottom pattern.
The following day, Amazon attempted to react bullishly to the pattern but pulled back on June 16 due to bearish price action in the general markets.
- On Friday, Amazon attempted to push higher again and closed the trading day near the high-of-day, which caused the stock to print a bullish engulfing candlestick. On Tuesday, Amazon looked to be gaining momentum in order to follow through on the move and make a meaningful bounce to the upside.
- A large bounce, at least to form a lower high on the weekly chart, is also likely becacuse Amazon has formed exaggerated bullish divergence on the daily chart.
- Exaggerated bullish divergence occurs when a stock fails trades mosty flat while the relative strength index (RSI) makes a series of higher lows. For the divergence to correct, Amazon will either need to trade higher or the stock will have to decline sharply to force the RSI to plummet.
- Traders looking to play Amazon’s bounce to the upside can watch to see how the stock reacts to resistance at the eight-day and 21-day exponential moving averages, which have been acting as resistance since June 9.
- For traders who enter into a position, Amazon is likely to signal when the next lower high is in by printing a bearish reversal candlestick, such as a shooting star or hanging man candlestick, on larger time frames.
- Amazon has resistance above at $109.30 and $117.16 and support below near the $100 level and at $95.49.
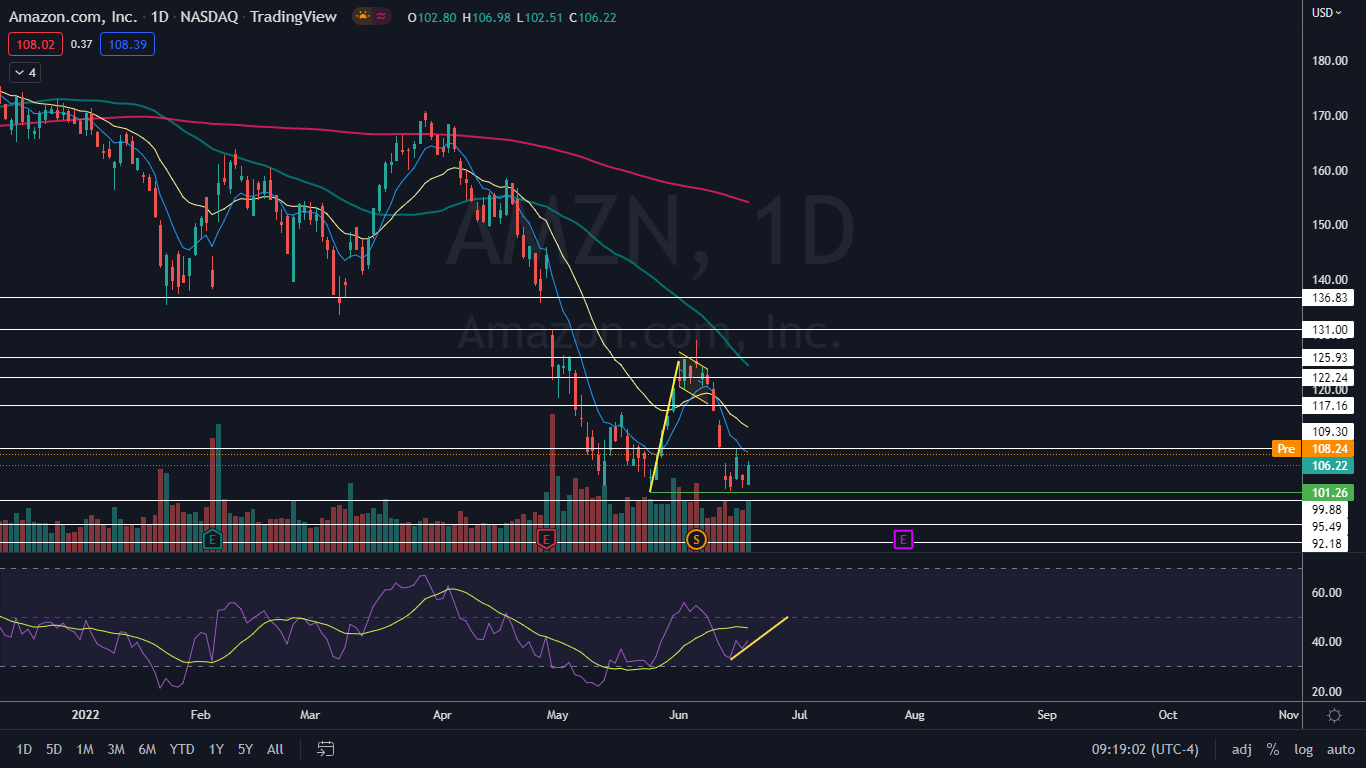
Photo courtesy of Amazon.