“Are we in a recession?” seems to be the question on everyone’s minds these days. But something better to ask might be “Why is it so hard to tell if we’re in a recession, anyway?”
In 2022, a litany of grim economic reports created a mountain of volatility in the stock market, and the commonly-held practice of owning bonds as portfolio ballast proved anything but effective. Selloffs spread like wildfire in the endemic stage of COVID-19—it truly has been an age of anxiety for investors, but does it have to be?
Are we really in a recession?
Just What Exactly Is a Recession? A Short History of the Term
The popularly held definition of recession is two consecutive quarters of negative GDP growth. This first appeared in an article in The New York Times by economist Julius Shiskin in 1974. Nearly 50 years ago, Shiskin himself was scratching his head over the idea. “There has been little or no discussion of the definition of recession,” he wrote, “Almost everyone agrees we are in one, but no one is saying what it is.”
Shiskin goes on to float a few qualitative factors that could indicate recession, such as a 1% increase in the unemployment rate, or a prolonged stretch of rising prices. But none of these factors took hold like the idea of two consecutive quarters of declining GDP output—Shiskin had actually included three quarters of decline in his definition because, after the crippling oil embargo of 1973, those were the tough headwinds America was facing.
It does make sense to consider domestic output as the primary indicator of a country’s economic health; in a nutshell, GDP illustrates both an economy’s size and its rate of performance. GDP also measures corporate profits as well as inventory data for all major sectors of the economy. Encapsulating all of this data into one metric, therefore, is a handy gauge for economists:
- An economy that grows its GDP at a rate of 3% of higher or higher is typically considered healthy
- 0% to about 2.7% growth is viewed as sluggish
- A negative GDP growth rate indicates an economy in trouble
But the official arbiter of U.S. recessions is from the National Bureau of Economic Research. It defines a recession as “a significant decline in economic activity that is spread across the economy and that lasts more than a few months.”
That could mean two quarters of consecutive GDP decline, but not always—in fact, in the most recent recession, which took place just two months after the COVID-19 stock market crash of 2020, GDP had declined for only 1 quarter before the economy experienced recession.
What’s more, the NBER says it takes a retrospective approach to recessions, waiting until sufficient data is available to make its announcements, which usually means it doesn’t declare a recession until 12–18 months after the fact. After all, the NBER does not want to revise something as important as a recession announcement because it knows the markets will not respond lightly to the news.
But in the meantime, investors don’t have to sit and wonder. We’ve put together a list of a few real-time economic indicators to keep an eye on in order to tell if we’re nearing or in a recession.
4 Other Ways to Tell if We’re in a Recession
While two quarters of negative GDP growth may be the most popular recession indicator, considering these other factors in ensemble can help paint a fuller picture of the state of the economy.
Yield Curve Inversion
Successful investing is often a balance of risk and reward. Longer-term Treasury Securities typically offer higher yields than shorter-term Treasuries in order to compensate the investor for the increased risks that they are taking. But sometimes the yields on the short-term Treasuries (specifically the 2-year Treasury) surpass those of the long-term security (the 10-year Treasury). When this happens, the yield curve is said to have inverted.
Duke Professor Campbell Harvey was the first to postulate that sustained yield curve inversion almost always leads to recession. It typically happens during periods of rising inflation or other worrisome news about declining auto sales, wage growth, or other economic indicators.
The only question that remains after the yield curve inverts is, when will the recession happen? According to data from the St. Louis Federal Reserve, that could take anywhere from 6 months to 3 years:
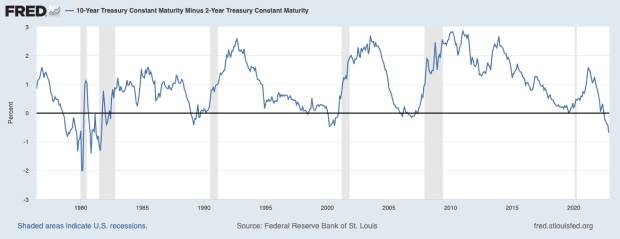
In this chart from the Federal Reserve Bank of St. Louis, the blue line illustrates yield curve inversion when it dips below 0 (in other words, times of economic distress), while the gray bars indicate periods of recession. See how closely they correlate?
Where to Find This Information: Investors can see this phenomenon up close and personal by visiting the U.S. Department of the Treasury’s website, which publishes bond yields daily after the market closes.
Spikes in the Volatility Index (VIX)
The Chicago Board of Exchange’s Volatility Index, commonly known as the VIX, is one of the best indicators of market volatility, and periods of pronounced volatility go hand-in-hand with economic weakness.
The VIX is calculated using market prices of S&P 500 put and call options. Basically, the higher the VIX reads, the more turbulent the trading environment—generally speaking, when the VIX rises, the S&P 500 drops.
Here’s how to interpret its measurements:
- A VIX level above 20 is typically considered “high.”
- Anything below 12 is typically considered “low.”
- Readings between 12 and 20 is considered “normal.”
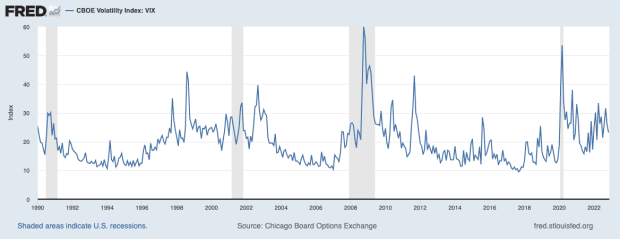
As you can see, big volatility spikes go hand-in-hand with recession.
Where to Find This Information: To view the VIX’s current reading, visit the Chicago Board of Options Exchange’s website, which is updated daily.
Rising Unemployment
According to the International Monetary Fund, healthy economies can be measured by the number of people working. It’s Economics 101: When economies grow, demand for products and services increase, but when they contract, demand falls. Less demand means manufacturers produce less and have lower inventories and thus employ fewer workers. Unemployment, therefore, is a great indicator of recession because it usually always rises during recessionary periods.
During the Financial Crisis of 2007–2008, set in motion by the implosion of the U.S. subprime mortgage market, a staggering 200 million people lost their jobs worldwide, ushering in a two-year malaise known as the Great Recession.
One Harvard Professor, Arthur Okun, postulated that production rises in countries that also witness declining unemployment. He believed each percentage loss of employment correlated to about a 2% decline in its potential GDP.
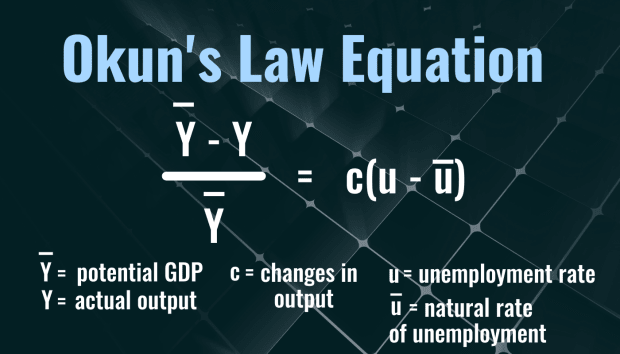
tofumax from GettyImages; Canva
It’s always hard for economists to gauge “potential,” so Okun’s Law is used more as a “rule of thumb” rather than a precise measurement. However, in 2007, the Federal Reserve Bank of Kansas City did use actual data to test Okun’s findings and concluded in agreement. “Growth slowdowns typically coincide with rising unemployment,” they said.
Where to Find This Information: You don’t need to break out the calculus to determine where unemployment stands—simply look at the monthly Jobs Report, officially known as the Employment Situation Report. It’s released on the first Friday of every month by the U.S. Bureau of Labor Statistics.
Stock Market Crashes
Finally—and this might seem like a no-brainer—but one of the best red flags of a recession may well be stock market crashes, which are defined as steep declines in stock market indexes of 10% or greater.
This chart illustrates a list of major stock market crashes as well as recessions since 1929. While a stock market crash doesn’t precede every recession, in most historical cases, a recession did follow.
As you can see, every major stock market crash except for the one in 1987—has preceded a recession. There was no recession after the Black Monday Crash of 1987, but its cause seemed to stem more from technical malfunctions than deterioration in the economy—and quick thinking from the Federal Reserve prevented a total meltdown.
Where to Find this Information: You probably won’t need to look too hard to know when the stock market is crashing—all the major news platforms, including TheStreet, will have that covered.
The Last Word on Recessions
So, are we in a recession? Only time will tell what the NBER decides—and just when it will make the official announcement.