Apple, Inc (NASDAQ:AAPL) was trading about 1.7% lower on Tuesday in sympathy with the S&P 500, which was retracing about 0.7%. Apple’s decline was taking place completely within Monday’s price action, which has caused the stock to develop inside bar patterns on the daily chart.
An inside bar pattern indicates a period of consolidation and is usually followed by a continuation move in the direction of the current trend.
An inside bar pattern has more validity on larger time frames (four-hour chart or larger). The pattern has a minimum of two candlesticks and consists of a mother bar (the first candlestick in the pattern) followed by one or more subsequent candles. The subsequent candle(s) must be completely inside the range of the mother bar and each is called an "inside bar."
A double, or triple inside bar can be more powerful than a single inside bar. After the break of an inside bar pattern, traders want to watch for high volume for confirmation the pattern was recognized.
- Bullish traders will want to search for inside bar patterns on stocks that are in an uptrend. Some traders may take a position during the inside bar prior to the break while other aggressive traders will take a position after the break of the pattern.
- For bearish traders, finding an inside bar pattern on a stock that's in a downtrend will be key. Like bullish traders, bears have two options of where to take a position to play the break of the pattern. For bearish traders, the pattern is invalidated if the stock rises above the highest range of the mother candle.
- Want direct analysis? Find me in the BZ Pro lounge! Click here for a free trial.
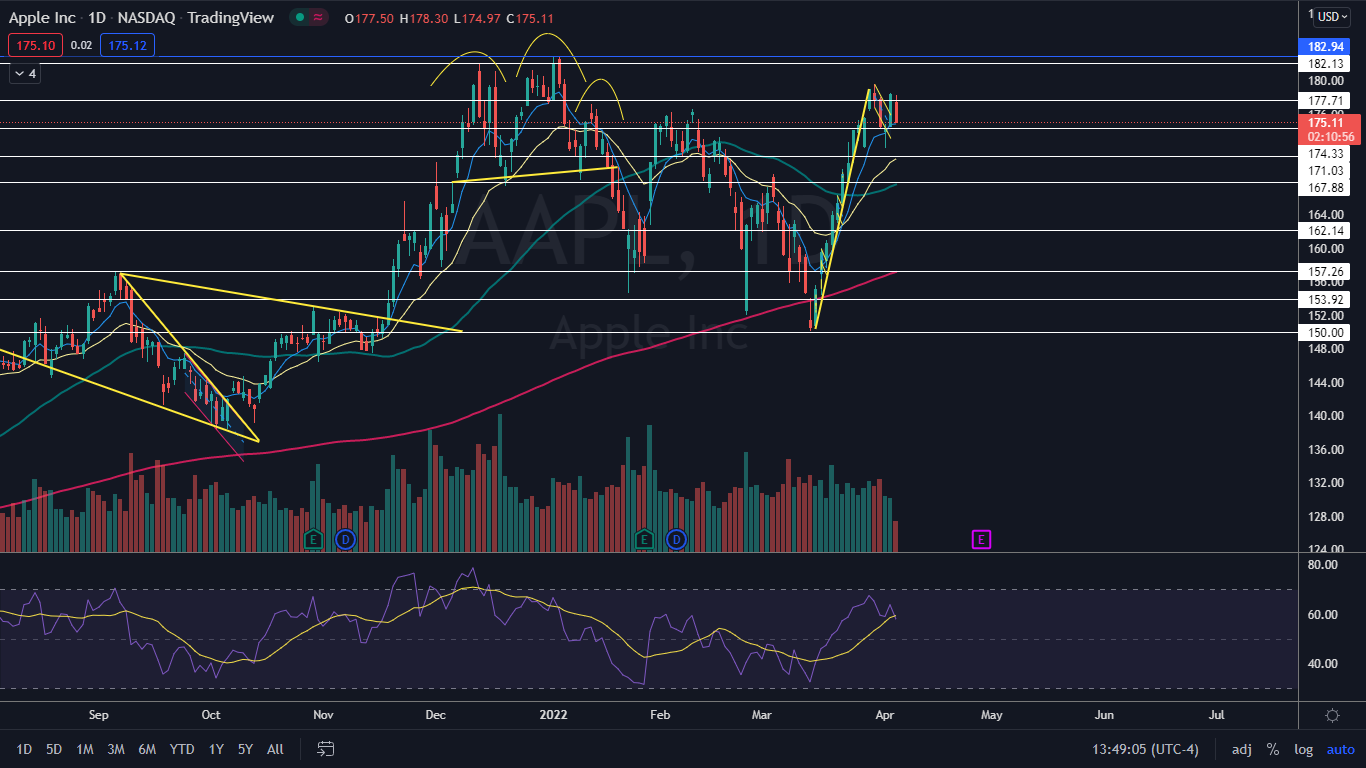
The Apple Chart: On Monday, Apple broke up from a bull flag pattern on the daily chart, which Benzinga called out on March 31. The stock didn’t receive momentum on the move, however, and on Tuesday Apple looked to be back testing the upper descending trendline of the flag formation. If volume returns on Tuesday to break the stock up from the inside bar, the $211 target could still be in play.
- The move lower on Tuesday came on lower-than-average volume, which is expected on an inside bar pattern because it indicates consolidation. By midafternoon, only about 43 million Apple shares had exchanged hands compared to the 10-day average of 89.21 million.
- The eight-day exponential moving average (EMA) has been helping to guide Apple higher since March 18 when the stock regained the level as support. For short-term bullish traders, a loss of the level could provide a solid exit point, while for traders wanting to enter into a short position a loss of the eight-day EMA could provide an entry point.
- If the stock breaks up from the inside bar pattern it's likely to print a higher high above the most recent high of $179.61 created on March 30.
- If Apple breaks bearishy from the inside bar and falls below the most recent higher low that was printed on April 1 at the $171.94 level, the uptrend the stock has been trading in since March 15 will be negated, which could indicate lower prices are on the horizon.
- Apple has resistance above at $177.71 and $182.13 and support below at $174.33 and $171.03.