Have you ever wondered why flying an airplane requires certification while practicing fundamental and technical analysis does not? Obviously, misreading the altimeter may have disastrous consequences far beyond that of misinterpreting earnings and chart signals. However, one of the key distinguishing factors — beyond safety considerations — is contingency or lack thereof, which, in a roundabout way brings us to Kraft Heinz (KHC).
From a near-term trading perspective, I’m bullish on KHC stock. However, my argument is based on a non-contingent empirical observation. In other words, I’m able to answer the five words no analyst wants to hear: how do you know that?
On surface level, skepticism toward the bullish narrative of KHC stock is more than warranted. According to the Barchart Technical Opinion indicator, Kraft Heinz is rated as an 88% Strong Sell. Analysts overwhelmingly rate KHC as a consensus Hold, with only two experts out of 22 expressing a directly optimistic view. Finally, options traders don’t seem particularly enthused, with KHC’s total options volume on Monday landing at 25,183 contracts, which was 17.34% below the trailing-month average.
Some fundamental analysts might point to KHC stock trading at a trailing-year earnings multiple of 22.43, which is lower than the multiple of 27.67 back in December 2024. It’s at this juncture that the reader would have to ask: how do you know that (a P/E ratio of 22.43 is “good”)?
A technical analyst might point to KHC stock being down 16% year-to-date as evidence that the security is due for a comeback. But again, the reader would have to ask: how do you know that (sustained red ink will lead to a reversal rather than a continuation of volatility)?
Anytime you come across a claim, you need to ask consistently, relentlessly: HOW DO YOU KNOW THAT?
If the answer is unsatisfactory, it’s not good analysis. In fact, it might not even be analysis at all.
Pivoting Away from Authorial Assertions to Data Science for KHC Stock
One of the scariest implications of the fundamental and technical approach is that the premise and the conclusion are contingent and self-referential. From an epistemological framework, it’s incredibly difficult to distinguish between a traditional market analysis and an acute episode of irrationality. Because the validity of the approach is observer-dependent, the goalposts are constantly shifting due to unfalsifiable claims.
In contrast, the quantitative approach builds the argument from independent observable fact. For example, KHC stock has printed in the trailing 10 weeks a 4-6-D sequence: four up weeks, six down weeks, with an overall downward trajectory. The actual sequence isn’t important per se. Rather, the significance is that this discrete event can be tracked as its own individual population group.
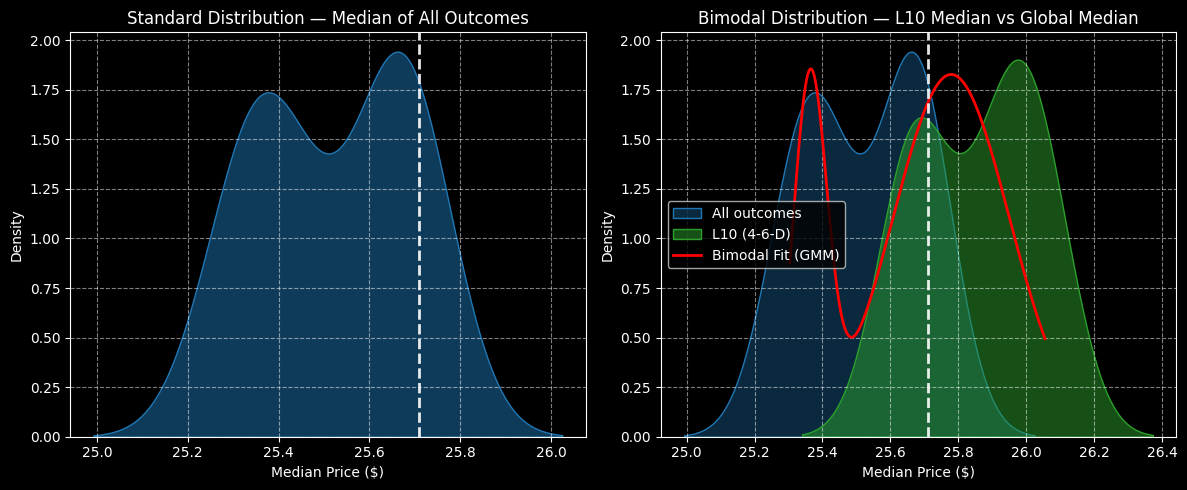
Moving forward, the idea is to stack the probabilistic distribution of outcomes associated with the 4-6-D sequence on top of the standard distribution of all outcomes, thus forming a bimodal distribution. Any favorable anomalies between the two population groups could then form the basis of a bullish strategy.
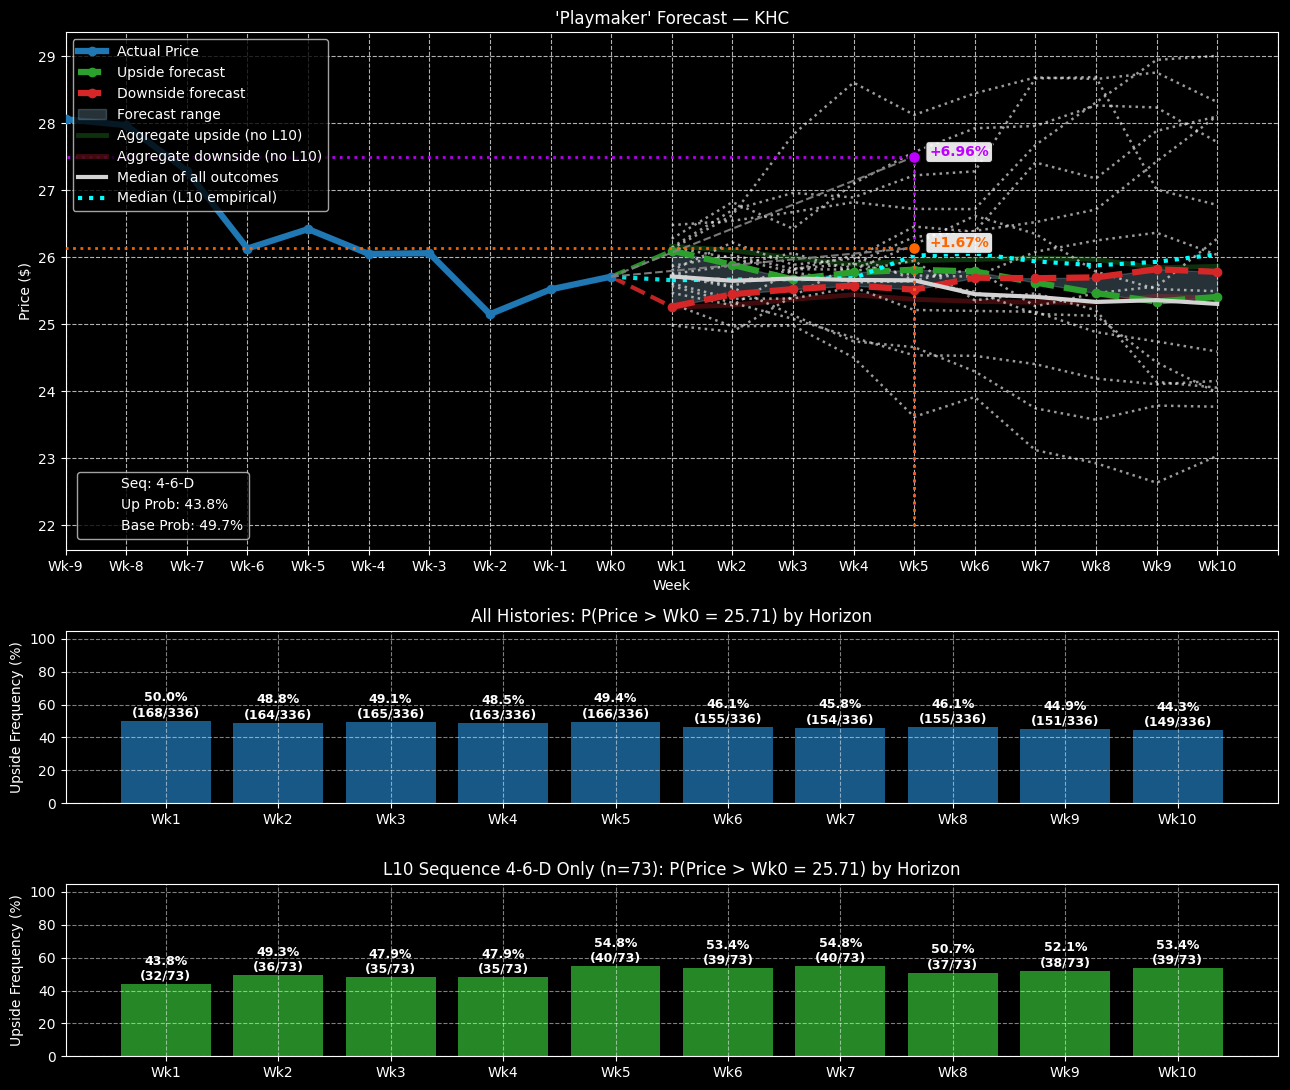
Using pricing data going back to January 2019, under aggregate conditions, KHC stock would be expected to have a forward 10-week exceedance ratio (profitability rate) of 44.3%, a negative bias. Further, on a density basis, prices would be expected to cluster around $25.50 (assuming an anchor price of $25.71, Monday’s close).
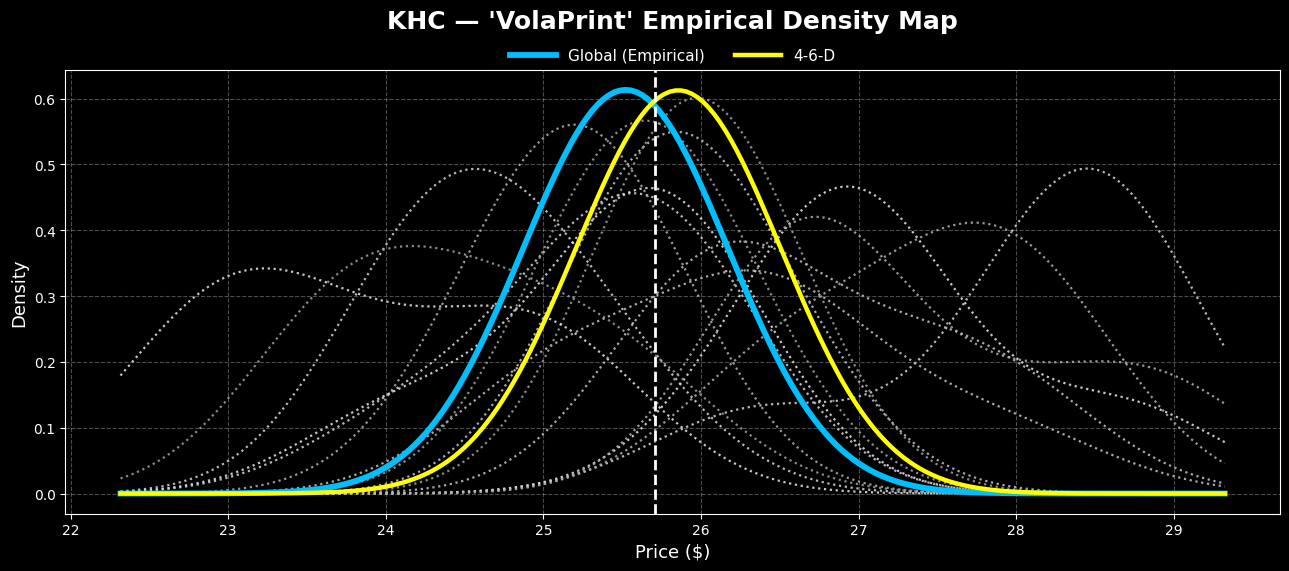
However, under 4-6-D conditions, the exceedance ratio would be expected to reach 53.4%, which admittedly isn’t great. Still, it’s a sizable improvement over the baseline probability. Further, prices would be expected to cluster around $26.
To be fair, a positive variance of 1.96% isn’t much to write home about. However, with an options strategy — specifically a vertical spread — this variance could translate to a surprisingly sizable payout.
Finally, some weeks would be expected — under 4-6-D conditions — to have exceedance ratios nearing 55%. While that’s still not great, there’s an empirical basis to believe that investors will buy the dip. So long as this observation continues to hold temporally, the bulls have a mathematical edge.
An Aggressive Wager for the Data-Driven Speculator
For those who don’t mind taking an aggressive but rational wager, the 25.00/27.50 bull call spread expiring Nov. 21 could be enticing. This trade would require KHC stock to rise through the second-leg strike price at expiration. Doing so would trigger a maximum payout of over 119%.
It must be stated that the jump to $27.50 is a steep one. However, the breakeven price for this trade is $26.14, which would be estimated to have a probability closer to 50% rather than the 41.8% that Black-Scholes-derived formulations indicate.
By no means is this an easy trade as there are high risks. But based on the empirical conditions laid out earlier, KHC stock options may be favorably mispriced.