You may feel as though you’re experiencing mild déjà vu viewing GOBankingRates 2025 ranking of America’s safest and wealthiest retirement towns. The second annual ranking expanded to feature 50 retirement towns compared to 2024’s top 30. And for the second year running, no Florida retirement hotspots were able to break into the list.
Explore More: GOBankingRates Original Research Center
View Next: Mark Cuban Says Trump's Executive Order To Lower Medication Costs Has a 'Real Shot' -- Here's Why
GOBankingRates analyzed data from the U.S. Census to identify which retirement towns have a percentage of the population ages 65+ of at least 20% and the percentage of households that have selected monthly costs as a percentage of household income above and below 30%.
Sperling’s BestPlaces and the Bureau of Labor Statistics Consumer Expenditure Survey were sourced for their cost of living indexes and average household expenditure costs. For determining each town’s overall safety, we studied crime data from the FBI and calculated the property and violent crime rates per 1,000 residents.

Key Findings
- Pinehurst, North Carolina, ranks as America’s safest and wealthiest retirement town. Pinehurst held second place in 2024. Only one other North Carolina town, Leland, broke into the top 50.
- Five new retirement towns cracked the top 10. They include Hot Springs Village, Arkansas (#2); Beavercreek, Ohio (#5); Leawood, Kansas (#7); Leland, North Carolina (#8); and Sahuarita, Arizona (#9).
- 10 California towns received mentions in the top 50: Rancho Palos Verdes (#4), Lincoln (#20), Laguna Woods (#23), Saratoga (#24), Fountain Valley (#27), Rancho Mirage (#32), Pacifica (#34), Seal Beach (#45), La Quinta (#48) and Camarillo (#50). Though this is a decline from 12 towns in 2024, four towns (Saratoga, Fountain Valley, Pacifica and Camarillo) are new to this year’s ranking.
- No Florida retirement towns appeared in the top 50.
Keep reading to find out which retirement towns are among the safest and wealthiest in America. And see which retirement towns made our 2024 ranking, too.
Learn More: How Much the Average Middle-Class Retiree Spends Monthly at Age 65
Find Out: I Asked ChatGPT Where To Retire on $2,000 a Month — Here’s What It Said

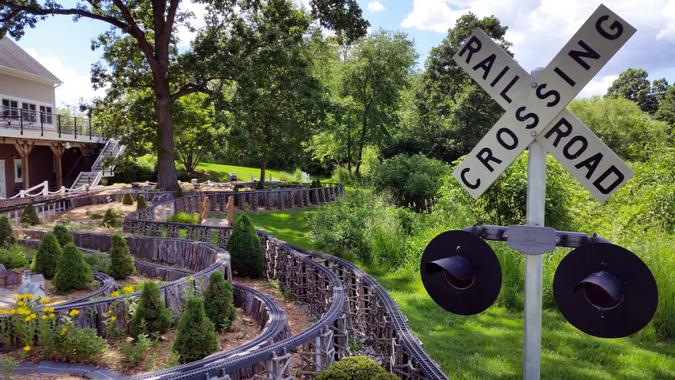
1. Pinehurst, North Carolina
- % of population 65+: 39.4%
- Average retirement income (before Social Security): $51,767
- % of households that pay under 30% for housing costs: 78.5%
- Property crime rate (per 1,000): 2.78
- Violent crime rate (per 1,000): 0.59
For You: 5 Ways To Make Money in Retirement Without Going Back To Work Full Time
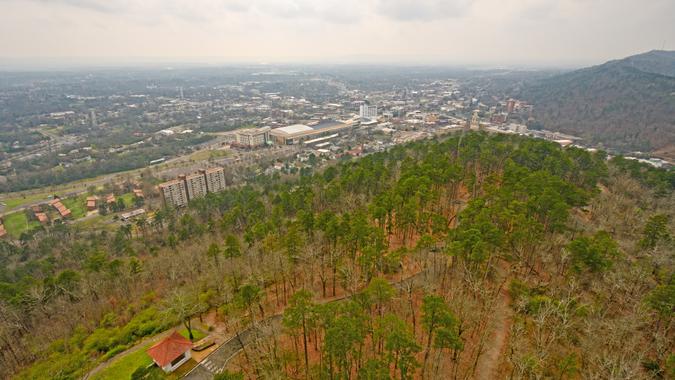
2. Hot Springs Village, Arkansas
- % of population 65+: 59.9%
- Average retirement income (before Social Security): $38,156
- % of households that pay under 30% for housing costs: 77.6%
- Property crime rate (per 1,000): 1.89
- Violent crime rate (per 1,000): 0.88

3. Oro Valley, Arizona
- % of population 65+: 34.9%
- Average retirement income (before Social Security): $53,668
- % of households that pay under 30% for housing costs: 83.10%
- Property crime rate (per 1,000): 11.48
- Violent crime rate (per 1,000): 0.51

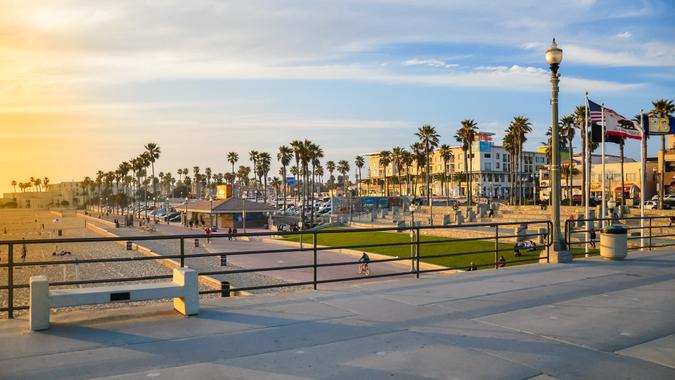
4. Rancho Palos Verdes, California
- % of population 65+: 26%
- Average retirement income (before Social Security): $82,079
- % of households that pay under 30% for housing costs: 69%
- Property crime rate (per 1,000): 8.83
- Violent crime rate (per 1,000): 0.92
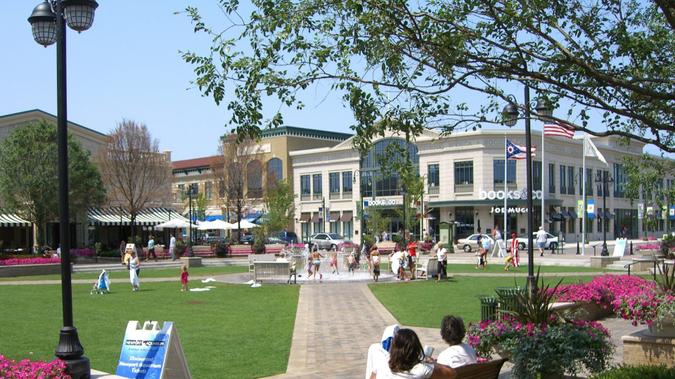
5. Beavercreek, Ohio
- % of population 65+: 20.6%
- Average retirement income (before Social Security): $52,492
- % of households that pay under 30% for housing costs: 85.7%
- Property crime rate (per 1,000): 19.94
- Violent crime rate (per 1,000): 0.74
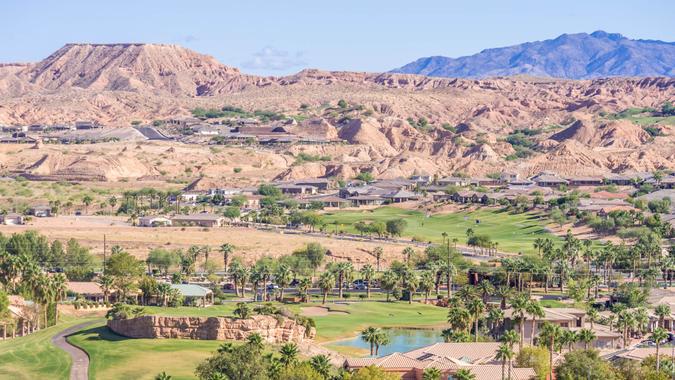
6. Mesquite, Nevada
- % of population 65+: 45%
- Average retirement income (before Social Security): $40,935
- % of households that pay under 30% for housing costs: 77.7%
- Property crime rate (per 1,000): 10.06
- Violent crime rate (per 1,000): 1.23
Try This: Extreme Frugality in Retirement — 15 Practical Ways To Cut Costs
7. Leawood, Kansas
- % of population 65+: 22.2%
- Average retirement income (before Social Security): $57,048
- % of households that pay under 30% for housing costs: 82.2%
- Property crime rate (per 1,000): 15.20
- Violent crime rate (per 1,000): 0.59
8. Leland, North Carolina
- % of population 65+: 27.6%
- Average retirement income (before Social Security): $43,945
- % of households that pay under 30% for housing costs: 78.5%
- Property crime rate (per 1,000): 9.83
- Violent crime rate (per 1,000): 0.96

9. Sahuarita, Arizona
- % of population 65+: 21.2%
- Average retirement income (before Social Security): $43,801
- % of households that pay under 30% for housing costs: 81.7%
- Property crime rate (per 1,000): 9.77
- Violent crime rate (per 1,000): 0.92
10. Bella Vista, Arkansas
- % of population 65+: 31.9%
- Average retirement income (before Social Security): $31,198
- % of households that pay under 30% for housing costs: 84.8%
- Property crime rate (per 1,000): 4.89
- Violent crime rate (per 1,000): 2.02
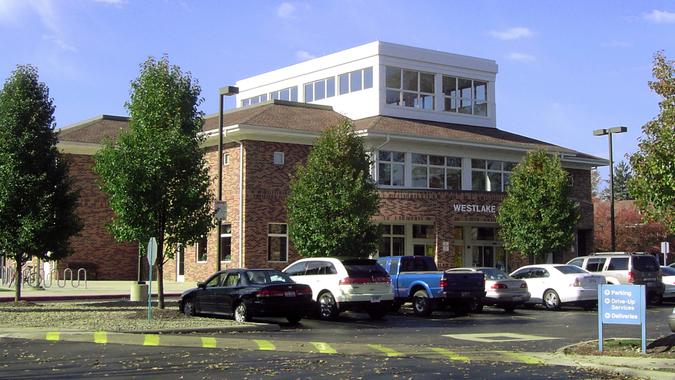
11. Westlake, Ohio
- % of population 65+: 24.2%
- Average retirement income (before Social Security): $40,760
- % of households that pay under 30% for housing costs: 79.2%
- Property crime rate (per 1,000): 6.49
- Violent crime rate (per 1,000): 0.29
Be Aware: 10 Bills That Drain Your Retirement Savings — and How To Cancel Them

12. Georgetown, Texas
- % of population 65+: 28.2%
- Average retirement income (before Social Security): $50,471
- % of households that pay under 30% for housing costs: 78.1%
- Property crime rate (per 1,000): 11.70
- Violent crime rate (per 1,000): 1.91
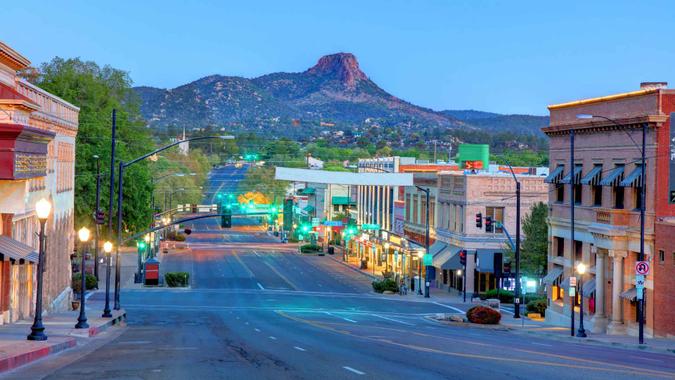
13. Prescott, Arizona
- % of population 65+: 40.5%
- Average retirement income (before Social Security): $42,545
- % of households that pay under 30% for housing costs: 79.3%
- Property crime rate (per 1,000): 11.17
- Violent crime rate (per 1,000): 3.35

14. Centerville, Ohio
- % of population 65+: 29.6%
- Average retirement income (before Social Security): $37,035
- % of households that pay under 30% for housing costs: 78.1%
- Property crime rate (per 1,000): 10.08
- Violent crime rate (per 1,000): 0.38

15. Strongsville, Ohio
- % of population 65+: 23.1%
- Average retirement income (before Social Security): $41,051
- % of households that pay under 30% for housing costs: 78.9%
- Property crime rate (per 1,000): 12.83
- Violent crime rate (per 1,000): 0.72

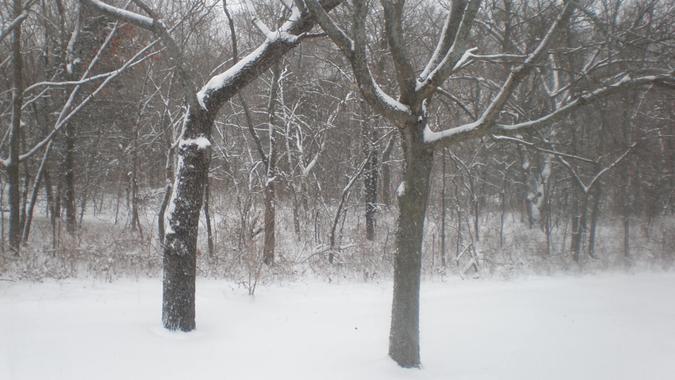
16. New Berlin, Wisconsin
- % of population 65+: 22.9%
- Average retirement income (before Social Security): $31,831
- % of households that pay under 30% for housing costs: 79.9%
- Property crime rate (per 1,000): 9.93
- Violent crime rate (per 1,000): 0.62
For You: Retirees Share the One Thing They Regret Not Saving For

17. Brookfield, Wisconsin
- % of population 65+: 23.1%
- Average retirement income (before Social Security): $44,144
- % of households that pay under 30% for housing costs: 78.2%
- Property crime rate (per 1,000): 10.97
- Violent crime rate (per 1,000): 0.83
18. Bethel Park, Pennsylvania
- % of population 65+: 24.4%
- Average retirement income (before Social Security): $33,619
- % of households that pay under 30% for housing costs: 77.8%
- Property crime rate (per 1,000): 6.31
- Violent crime rate (per 1,000): 0.59

19. Germantown, Tennessee
- % of population 65+: 23.9%
- Average retirement income (before Social Security): $51,024
- % of households that pay under 30% for housing costs: 76.5%
- Property crime rate (per 1,000): 11.77
- Violent crime rate (per 1,000): 1.68
20. Lincoln, California
- % of population 65+: 27.2%
- Average retirement income (before Social Security): $47,952
- % of households that pay under 30% for housing costs: 66.1%
- Property crime rate (per 1,000): 5.61
- Violent crime rate (per 1,000): 0.96

21. Surprise, Arizona
- % of population 65+: 22.4%
- Average retirement income (before Social Security): $35,965
- % of households that pay under 30% for housing costs: 75.8%
- Property crime rate (per 1,000): 8.76
- Violent crime rate (per 1,000): 1.09
See More: What to Do in Retirement: 15 Ideas To Stay Active, Happy and Financially Secure

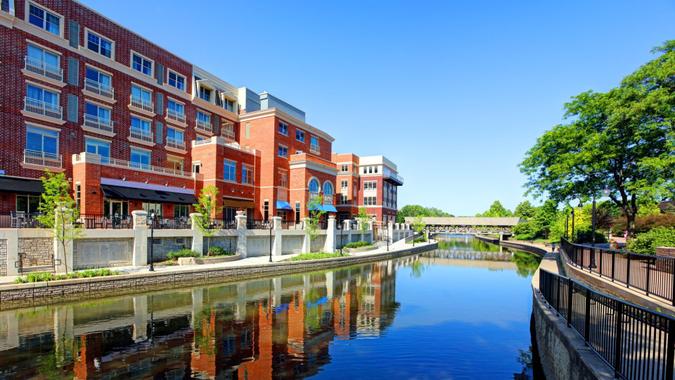
22. Northbrook, Illinois
- % of population 65+: 25.6%
- Average retirement income (before Social Security): $53,124
- % of households that pay under 30% for housing costs: 72.5%
- Property crime rate (per 1,000): 12.08
- Violent crime rate (per 1,000): 0.18
23. Laguna Woods, California
- % of population 65+: 83%
- Average retirement income (before Social Security): $43,934
- % of households that pay under 30% for housing costs: 62.4%
- Property crime rate (per 1,000): 8.93
- Violent crime rate (per 1,000): 0.60
24. Saratoga, California
- % of population 65+: 25.9%
- Average retirement income (before Social Security): $63,164
- % of households that pay under 30% for housing costs: 65.4%
- Property crime rate (per 1,000): 6.00
- Violent crime rate (per 1,000): 0.89
25. Huntley, Illinois
- % of population 65+: 35.1%
- Average retirement income (before Social Security): $33,656
- % of households that pay under 30% for housing costs: 67.6%
- Property crime rate (per 1,000): 4.29
- Violent crime rate (per 1,000): 0.28

26. Chesterfield, Missouri
- % of population 65+: 24.6%
- Average retirement income (before Social Security): $45,644
- % of households that pay under 30% for housing costs: 76.6%
- Property crime rate (per 1,000): 12.86
- Violent crime rate (per 1,000): 0.96
Trending Now: 5 Cities Where You Can Retire for $2,000 a Month and Enjoy All Four Seasons
27. Fountain Valley, California
- % of population 65+: 20.3%
- Average retirement income (before Social Security): $53,671
- % of households that pay under 30% for housing costs: 79.3%
- Property crime rate (per 1,000): 17.84
- Violent crime rate (per 1,000): 1.78

28. Mentor, Ohio
- % of population 65+: 22.9%
- Average retirement income (before Social Security): $31,828
- % of households that pay under 30% for housing costs: 81%
- Property crime rate (per 1,000): 13.58
- Violent crime rate (per 1,000): 1.15

29. Lake Oswego, Oregon
- % of population 65+: 22.9%
- Average retirement income (before Social Security): $49,560
- % of households that pay under 30% for housing costs: 72.1%
- Property crime rate (per 1,000): 11.00
- Violent crime rate (per 1,000): 0.66
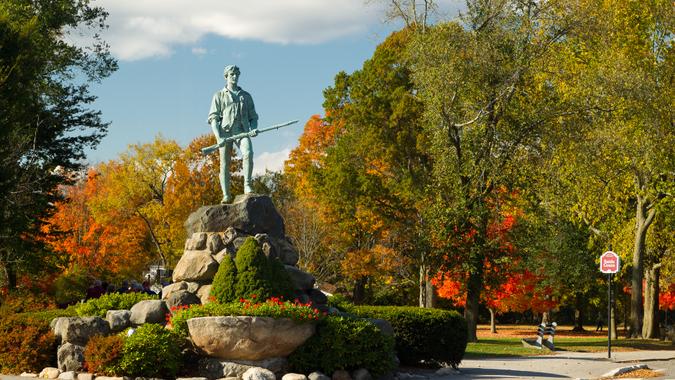
30. Lexington, Massachusetts
- % of population 65+: 21%
- Average retirement income (before Social Security): $54,503
- % of households that pay under 30% for housing costs: 70.8%
- Property crime rate (per 1,000): 3.35
- Violent crime rate (per 1,000): 0.52

31. Foley, Alabama
- % of population 65+: 32.5%
- Average retirement income (before Social Security): $37,952
- % of households that pay under 30% for housing costs: 77.1%
- Property crime rate (per 1,000): 15.29
- Violent crime rate (per 1,000): 1.93
Read Next: ‘You’ll Run Out of Money in 20 Years’ — Why Retirees Are Rethinking Their Savings Strategy
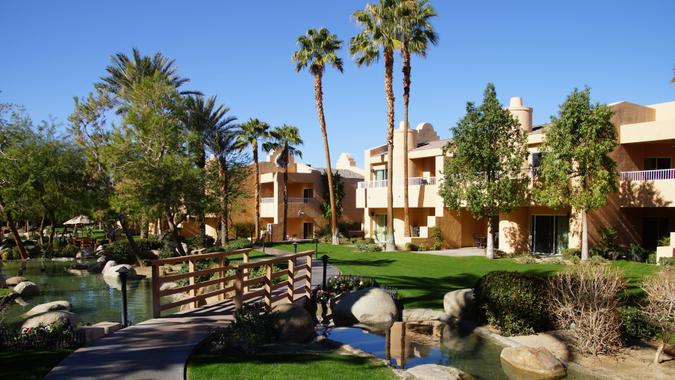
32. Rancho Mirage, California
- % of population 65+: 49.9%
- Average retirement income (before Social Security): $60,263
- % of households that pay under 30% for housing costs: 66.9%
- Property crime rate (per 1,000): 23.93
- Violent crime rate (per 1,000): 1.88

33. Sierra Vista, Arizona
- % of population 65+: 21.6%
- Average retirement income (before Social Security): $34,753
- % of households that pay under 30% for housing costs: 80.3%
- Property crime rate (per 1,000): 16.64
- Violent crime rate (per 1,000): 2.18

34. Pacifica, California
- % of population 65+: 20.3%
- Average retirement income (before Social Security): $49,270
- % of households that pay under 30% for housing costs: 73.3%
- Property crime rate (per 1,000): 13.06
- Violent crime rate (per 1,000): 1.45
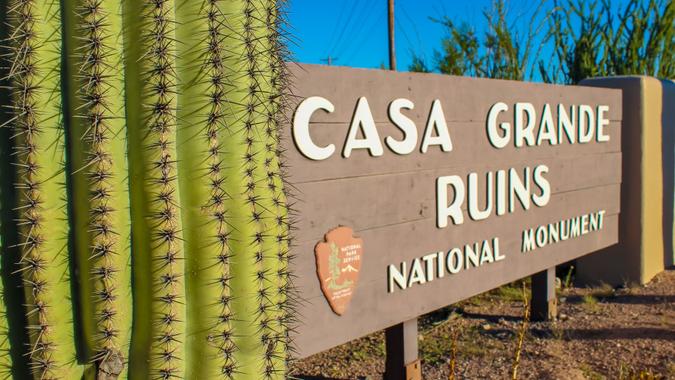
35. Casa Grande, Arizona
- % of population 65+: 20.3%
- Average retirement income (before Social Security): $55,940
- % of households that pay under 30% for housing costs: 77.4%
- Property crime rate (per 1,000): 15.29
- Violent crime rate (per 1,000): 4.10

36. Marana, Arizona
- % of population 65+: 21.7%
- Average retirement income (before Social Security): $35,142
- % of households that pay under 30% for housing costs: 77.3%
- Property crime rate (per 1,000): 13.50
- Violent crime rate (per 1,000): 1.16
That’s Interesting: How Kevin O’Leary’s $500K Retirement Plan Works
37. Farmington Hills, Michigan
- % of population 65+: 20.4%
- Average retirement income (before Social Security): $43,483
- % of households that pay under 30% for housing costs: 74.9%
- Property crime rate (per 1,000): 6.81
- Violent crime rate (per 1,000): 1.98
38. Tinley Park, Illinois
- % of population 65+: 20.1%
- Average retirement income (before Social Security): $41,527
- % of households that pay under 30% for housing costs: 72.6%
- Property crime rate (per 1,000): 12.45
- Violent crime rate (per 1,000): 1.09

39. Shelton, Connecticut
- % of population 65+: 20.1%
- Average retirement income (before Social Security): $39,157
- % of households that pay under 30% for housing costs: 70.8%
- Property crime rate (per 1,000): 7.09
- Violent crime rate (per 1,000): 0.42
40. Westerville, Ohio
- % of population 65+: 21.2%
- Average retirement income (before Social Security): $48,771
- % of households that pay under 30% for housing costs: 75.5%
- Property crime rate (per 1,000): 17.26
- Violent crime rate (per 1,000): 2.21

41. North Myrtle Beach, South Carolina
- % of population 65+: 38.7%
- Average retirement income (before Social Security): $44,091
- % of households that pay under 30% for housing costs: 78.6%
- Property crime rate (per 1,000): 32.23
- Violent crime rate (per 1,000): 3.61
Discover More: How Much the Average Middle-Class Retiree Spends Monthly at Age 67

42. Glenview, Illinois
- % of population 65+: 24.6%
- Average retirement income (before Social Security): $62,705
- % of households that pay under 30% for housing costs: 67.2%
- Property crime rate (per 1,000): 12.10
- Violent crime rate (per 1,000): 1.51

43. Parma, Ohio
- % of population 65+: 20.1%
- Average retirement income (before Social Security): $28,254
- % of households that pay under 30% for housing costs: 79.1%
- Property crime rate (per 1,000): 7.10
- Violent crime rate (per 1,000): 1.19

44. Prescott Valley, Arizona
- % of population 65+: 28.5%
- Average retirement income (before Social Security): $35,145
- % of households that pay under 30% for housing costs: 71.7%
- Property crime rate (per 1,000): 7.69
- Violent crime rate (per 1,000): 2.25

45. Seal Beach, California
- % of population 65+: 43.7%
- Average retirement income (before Social Security): $46,227
- % of households that pay under 30% for housing costs: 77.1%
- Property crime rate (per 1,000): 27.49
- Violent crime rate (per 1,000): 4.82
46. Manitowoc, Wisconsin
- % of population 65+: 22%
- Average retirement income (before Social Security): $23,993
- % of households that pay under 30% for housing costs: 81.7%
- Property crime rate (per 1,000): 9.70
- Violent crime rate (per 1,000): 2.08
Check Out: I Help People Retire Every Day — Here’s the Most Common Retirement Mistake People Make
47. Livonia, Michigan
- % of population 65+: 21.8%
- Average retirement income (before Social Security): $31,835
- % of households that pay under 30% for housing costs: 76.5%
- Property crime rate (per 1,000): 12.62
- Violent crime rate (per 1,000): 2.28
48. La Quinta, California
- % of population 65+: 31.1%
- Average retirement income (before Social Security): $54,427
- % of households that pay under 30% for housing costs: 65.9%
- Property crime rate (per 1,000): 19.45
- Violent crime rate (per 1,000): 1.77

49. Long Beach, New York
- % of population 65+: 20.7%
- Average retirement income (before Social Security): $44,579
- % of households that pay under 30% for housing costs: 64.2%
- Property crime rate (per 1,000): 1.04
- Violent crime rate (per 1,000): 0.78

50. Camarillo, California
- % of population 65+: 21.9%
- Average retirement income (before Social Security): $46,141
- % of households that pay under 30% for housing costs: 65.1%
- Property crime rate (per 1,000): 11.91
- Violent crime rate (per 1,000): 1.29
See more original studies and surveys in the GOBankingRates original research center.
Editor’s note: Photos are for representational purposes only and might not reflect the exact locations listed.
Methodology: Using the U.S. Census 2023 5-Year American Community Survey, GOBankingRates identified retirement towns with populations of at least 5,000 with at least 20% of the population age 65 and over. Also sourced from the Census were total households, median household income, average retirement income, monthly owner costs as a percentage of household income above and below 30%. The cost-of-living indexes were sourced from Sperling’s BestPlaces, and national expenditure costs for all households were sourced from Bureau of Labor Statistics Consumer Expenditure Survey. The average home value was sourced from Zillow Home Value Index and the average mortgage was calculated using data from the Federal Reserve. Using the average mortgage and expenditure costs, the total cost of living for necessities was calculated. Using the crime data from the FBI, property crimes and violent crimes committed were used to calculate the violent and property crime rates per 1,000 residents. The percentage of households that spend under 30% of household income on selected monthly owner costs was scored and weighted at 1.00, the percentage of homes with retirement income was scored and weighted at 1.00, the average retirement income for households that receive it was scored and weighted at 1.00, the property crime rate was scored and weighted at 1.00, and the violent crime rate was scored and weighted at 1.00. All the scores were summed and sorted to show the safest and wealthiest retirement towns. All data was collected on and is up to date as of Oct. 2, 2025.
More From GOBankingRates
This article originally appeared on GOBankingRates.com: America’s 50 Safest and Wealthiest Retirement Towns