GameStop Corp. (NYSE:GME) was trading slightly higher in the premarket on Wednesday after regaining the 200-day simple moving average (SMA) on Tuesday.
The 200-day SMA is an important bellwether. Technical traders and investors consider a stock trading above the level on the daily chart to be in a bull cycle, whereas a stock trading under the 200-day SMA is considered to be in a bear cycle.
The 50-day SMA also plays an important role in technical analysis, especially when paired with the 200-day. When the 50-day SMA crosses below the 200-day SMA, a death cross occurs whereas when the 50-day SMA crosses above the 200-day, a bullish golden cross takes place.
A death cross occurred on GameStop’s chart in December 2021, which dropped the stock into a long-term bear cycle. By March and May of this year, GameStop was trading as much as 55% below the 200-day, making the stock extended to the downside.
Over the course of June and July, GameStop has bounced back considerably and tested the 200-day SMA as resistance multiple times. Between July 18 and July 25, GameStop regained the 200-day SMA before falling back below the level.
Traders and investors will be watching to see if GameStop can hold above the level this time and if the stock can remain above the level for a period of time, a golden cross will occur.
Want direct analysis? Find me in the BZ Pro lounge! Click here for a free trial.
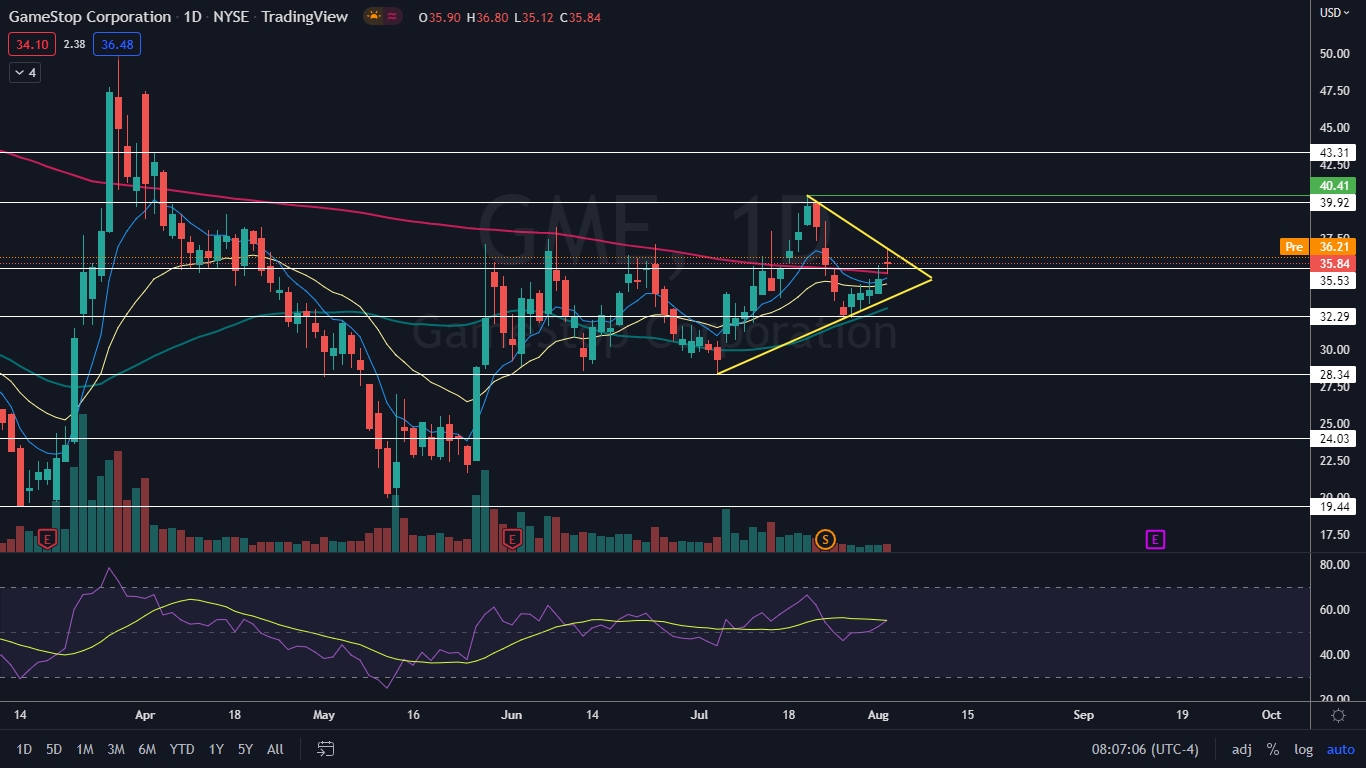
The GameStop Chart: Until Tuesday, when GameStop regained the 200-day SMA and the eight-day and 21-day exponential moving averages (EMAs), the stock looked to be settling into a bear flag pattern on the daily chart.
When GameStop regained the three moving averages, however, the bear flag was negated.
On Tuesday, GameStop closed the trading session mostly flat, which caused the stock to print a doji candlestick on the daily chart. A doji is often a reversal candlestick, which indicates GameStop could trade lower on Wednesday, which would cause GameStop to lose the 200-day SMA.
It should be noted that candlesticks are a lagging indicator because a subsequent candlestick on any given time frame has to print before the previous candlestick can be confirmed. Bullish traders and investors would prefer to see GameStop hold and consolidate above the 200-day SMA.
- GameStop may be settling into a symmetrical triangle on the daily chart, with the stock set to meet the apex on Aug. 9.
- If the pattern is recognized, traders can watch for the stock to break up or down from the pattern on higher-than-average volume to indicate future direction.
- GameStop has resistance above at $39.92 and $43.31 and support below at $35.53 and $32.29.