If you’re eyeing housing markets with a strong investing upside, you may want to check out the Keystone State.
Check Out: The GOBankingRates Original Research Center
Learn More: 5 Types of Cars Retirees Should Stay Away From Buying
Pennsylvania landed seven cities in the top 30 housing markets for growing your wealth this year. That’s based on a new GOBankingRates analysis, which looked at factors like percentage increases in home value over the past two years, the average sale-to-list ratio, and other criteria.

Key Findings
Here are a few more key findings:
- The 30 best bang-for-your buck housing markets are all located in the northern half of the U.S., east of the Mississippi River. Only two regions — the Midwest and the Northeast — are represented.
- After Pennsylvania, the most represented states are New York and Ohio, with five entries each. Wisconsin lands four locales on the list, including three in the top 10.
- All nine of the states represented in the list are located in the Rust Belt, or in historically industrialized regions.
- Among the cities in the list, Utica, New York, saw the largest one-year increase in home value (6.2%). Rockford, Illinois, saw the largest two-year bump — a whopping 18.25%.
Here are the 30 best housing markets to grow your wealth, counting down from 30 to 1 based on 10 weighted factors. You can find the full methodology at the end of the gallery.
Also see America’s best hidden gem housing markets.
Also See: 4 Housing Markets That Have Plummeted in Value Over the Past 5 Years
30. Akron, Ohio
- 1-year % change in home value: 3.70%
- 2-year % change in home value: 10.2%
- Average sale-to-list ratio: 100.2%
- % of listings with price cuts: 26%
Discover More: 4 States Where Home Prices Are Expected To Crash in the Next 12 Months

29. Youngstown, Ohio
- 1-year % change in home value: 4.99%
- 2-year % change in home value: 12.6%
- Average sale-to-list ratio: 97.5%
- % of listings with price cuts: 27.2%

28. Albany, New York
- 1-year % change in home value: 3.63%
- 2-year % change in home value: 10%
- Average sale-to-list ratio: 102.4%
- % of listings with price cuts: 21.9%

27. Harrisburg, Pennsylvania
- 1-year % change in home value: 4.04%
- 2-year % change in home value: 8.10%
- Average sale-to-list ratio: 100.8%
- % of listings with price cuts: 24.9%

26. Atlantic City, New Jersey
- 1-year % change in home value: 4.29%
- 2-year % change in home value: 13.3%
- Average sale-to-list ratio: 98%
- % of listings with price cuts: 21%
See More: 5 Cities Where Homes Will Be a Total Steal in 2 Years

25. Trenton, New Jersey
- 1-year % change in home value: 2.55%
- 2-year % change in home value: 11.4%
- Average sale-to-list ratio: 101.8%
- % of listings with price cuts: 17.4%

24. Lansing, Michigan
- 1-year % change in home value: 3.55%
- 2-year % change in home value: 9.8%
- Average sale-to-list ratio: 100.7%
- % of listings with price cuts: 24.2%

23. Manchester, New Hampshire
- 1-year % change in home value: 2.82%
- 2-year % change in home value: 10.6%
- Average sale-to-list ratio: 102.2%
- % of listings with price cuts: 21.7%

22. Madison, Wisconsin
- 1-year % change in home value: 2.56%
- 2-year % change in home value: 8.39%
- Average sale-to-list ratio: 101.8%
- % of listings with price cuts: 19.2%

21. Cleveland
- 1-year % change in home value: 4.48%
- 2-year % change in home value: 11.5%
- Average sale-to-list ratio: 100.2%
- % of listings with price cuts: 24.7%

20. Scranton, Pennsylvania
- 1-year % change in home value: 5.24%
- 2-year % change in home value: 13.1%
- Average sale-to-list ratio: 98.6%
- % of listings with price cuts: 24.4%

19. Allentown, Pennsylvania
- 1-year % change in home value: 3.29%
- 2-year % change in home value: 9.76%
- Average sale-to-list ratio: 101.4%
- % of listings with price cuts: 20.8%

18. Toledo, Ohio
- 1-year % change in home value: 3.56%
- 2-year % change in home value: 9.61%
- Average sale-to-list ratio: 99.4%
- % of listings with price cuts: 21.5%
Explore More: 12 East Coast Cities Where You Need To Earn Six Figures To Afford a Typical Home

17. Buffalo, New York
- 1-year % change in home value: 3.39%
- 2-year % change in home value: 9.92%
- Average sale-to-list ratio: 107.8%
- % of listings with price cuts: 20%

16. York, Pennsylvania
- 1-year % change in home value: 5.19%
- 2-year % change in home value: 9.43%
- Average sale-to-list ratio: 100.6%
- % of listings with price cuts: 25.7%

15. New Haven, Connecticut
- 1-year % change in home value: 3.68%
- 2-year % change in home value: 12.8%
- Average sale-to-list ratio: 102.8%
- % of listings with price cuts: 20.8%
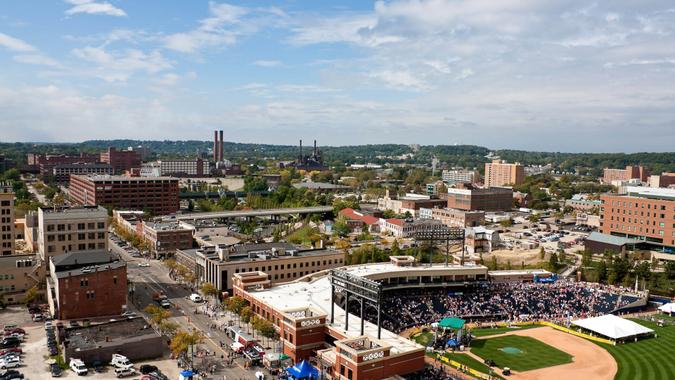
14. Utica, New York
- 1-year % change in home value: 6.20%
- 2-year % change in home value: 14.2%
- Average sale-to-list ratio: 98.9%
- % of listings with price cuts: 21.5%
Also See: 33 Cities Where You Need To Earn Six Figures To Afford a Typical Home

13. Canton, Ohio
- 1-year % change in home value: 5.95%
- 2-year % change in home value: 12.1%
- Average sale-to-list ratio: 99.6%
- % of listings with price cuts: 25.8%

12. Norwich, Connecticut
- 1-year % change in home value: 4.87%
- 2-year % change in home value: 13.5%
- Average sale-to-list ratio: 102.3%
- % of listings with price cuts: 19.8%

11. Lancaster, Pennsylvania
- 1-year % change in home value: 4.43%
- 2-year % change in home value: 8.77%
- Average sale-to-list ratio: 102.2%
- % of listings with price cuts: 21.3%

10. Milwaukee
- 1-year % change in home value: 3.18%
- 2-year % change in home value: 8.96%
- Average sale-to-list ratio: 102%
- % of listings with price cuts: 16.4%
Also Find: 7 California Cities Where You Need To Earn Six Figures To Afford a Typical Home

9. Reading, Pennsylvania
- 1-year % change in home value: 4.83%
- 2-year % change in home value: 10.8%
- Average sale-to-list ratio: 101.5%
- % of listings with price cuts: 20.8%

8. Syracuse, New York
- 1-year % change in home value: 5.29%
- 2-year % change in home value: 16.6%
- Average sale-to-list ratio: 105.6%
- % of listings with price cuts: 19.6%

7. Erie, Pennsylvania
- 1-year % change in home value: 6.19%
- 2-year % change in home value: 13.8%
- Average sale-to-list ratio: 101%
- % of listings with price cuts: 22.3%

6. Hartford, Connecticut
- 1-year % change in home value: 4.28%
- 2-year % change in home value: 14.1%
- Average sale-to-list ratio: 105.3%
- % of listings with price cuts: 18.2%
See More: 19 States Where You Don’t Have To Earn Six Figures To Buy a Home

5. Peoria, Illinois
- 1-year % change in home value: 7.99%
- 2-year % change in home value: 13.9%
- Average sale-to-list ratio: 99.4%
- % of listings with price cuts: 26.6%

4. Green Bay, Wisconsin
- 1-year % change in home value: 4.94%
- 2-year % change in home value: 12.5%
- Average sale-to-list ratio: 101.6%
- % of listings with price cuts: 14.1%

3. Rochester, New York
- 1-year % change in home value: 3.73%
- 2-year % change in home value: 11.8%
- Average sale-to-list ratio: 117.7%
- % of listings with price cuts: 13.7%

2. Rockford, Illinois
- 1-year % change in home value: 6.64%
- 2-year % change in home value: 18.3%
- Average sale-to-list ratio: 100.6%
- % of listings with price cuts: 19.1%

1. Appleton, Wisconsin
- 1-year % change in home value: 6.35%
- 2-year % change in home value: 12%
- Average sale-to-list ratio: 102.2%
- % of listings with price cuts: 11.8%
Methodology: For this piece, GOBankingRates analyzed the 200 largest Metro Statistical Areas (MSAs) and sourced the following factors from Zillow’s July 2025 data: 1) 1-year percent change in home value, 2) 1-year change in home value in USD, 3) 2-year percent change in home value, 4) 2-year change in home value in USD, 5) for-sale inventory, 6) mean days from listing to pending, 7) mean list-to-sale ratio, 8) mean days from pending to close, 9) share of listings with a price cut, and 10) mean price cut. All 10 factors were then scored and combined, with the highest scores representing the worst housing markets. In final calculations, factors 1, 2, 9 and 10 were weighted 2x and factor 5 was weighted 0.5x. All data is up to date as of Oct. 7, 2025.
More From GOBankingRates
This article originally appeared on GOBankingRates.com: 30 Hottest Housing Markets That Will Help You Build Wealth


.png?w=600)

