Yum! Brands (YUM) has been on fire lately. While the stock is up just 1% on Friday, a gain today would cement the stock’s seventh straight daily gain.
In that stretch, the stock is currently up 10%, as it made a very nice double-bottom in the $108 to $110 zone.
Foodies may be talking about whether Taco Bell, a branch under the Yum umbrella, will stop selling its Mexican Pizza. But we’re over here talking about the chart.
This isn’t the only fast-food chain in the news, either.
Wendy’s (WEN) was a hot topic this week as Nelson Peltz’s Trian Partners contemplates a takeover bid.
The chart is also holding a key level as well. Can Yum! Brands stock continue to hold up after the recent run? Let’s look.
Trading Yum Stock
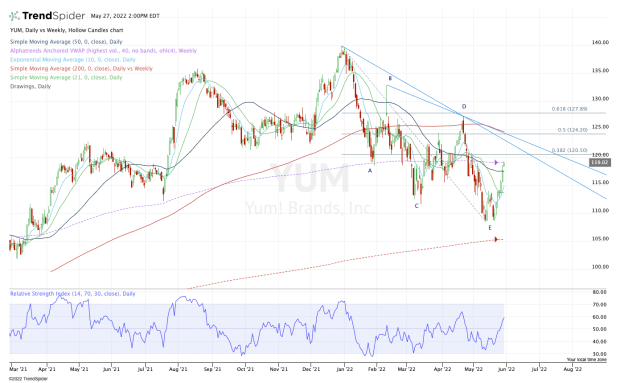
Chart courtesy of TrendSpider.com
It’s been a choppy ride in Yum stock, but the nice lift out of the $108 area shows promise. At the very least, it gives bulls a level to measure against.
If this level breaks and the stock closes below $108, that likely opens the door down to the 200-week moving average and potentially the $100 area.
As it stands now though, I’d love to see the stock find support in the $114 to $115 area. That takes a little momentum out of the stock, but keeps the overall trend intact for the bulls.
It also keeps it above the 10-day and 21-day moving averages.
The stock may not be going gangbusters on Friday, but its rally is enough to push Yum! Brands up through the 50-day moving average. As it hovers at the monthly high, it leaves open the possibility that we get a more meaningful rotation in June — a monthly-up rotation.
For the moment, bulls are likely keeping a keen eye on the weekly VWAP reading, which is halting today’s rally in its tracks.
If the stock dips, $114 to $115 is key. If it doesn’t and Yum! Brands can power through, the $120 area is of immediate interest. That’s where we find the 38.2% retracement.
Above that and $124 to $125 is on the table. There we find various downtrends (blue lines), as well as the 50% retracement.
In short, let’s see how it handles this current VWAP measure. If we dip, buyers can look for support nearby. If it pushes through, they have their next upside targets handy.