On Thursday evening, Benzinga asked its followers on Twitter what they’re buying at the open on Friday. From the replies Benzinga selected one ticker for technical analysis.
@ArguetaSal is buying Advanced Micro Devices, Inc (NASDAQ:AMD).
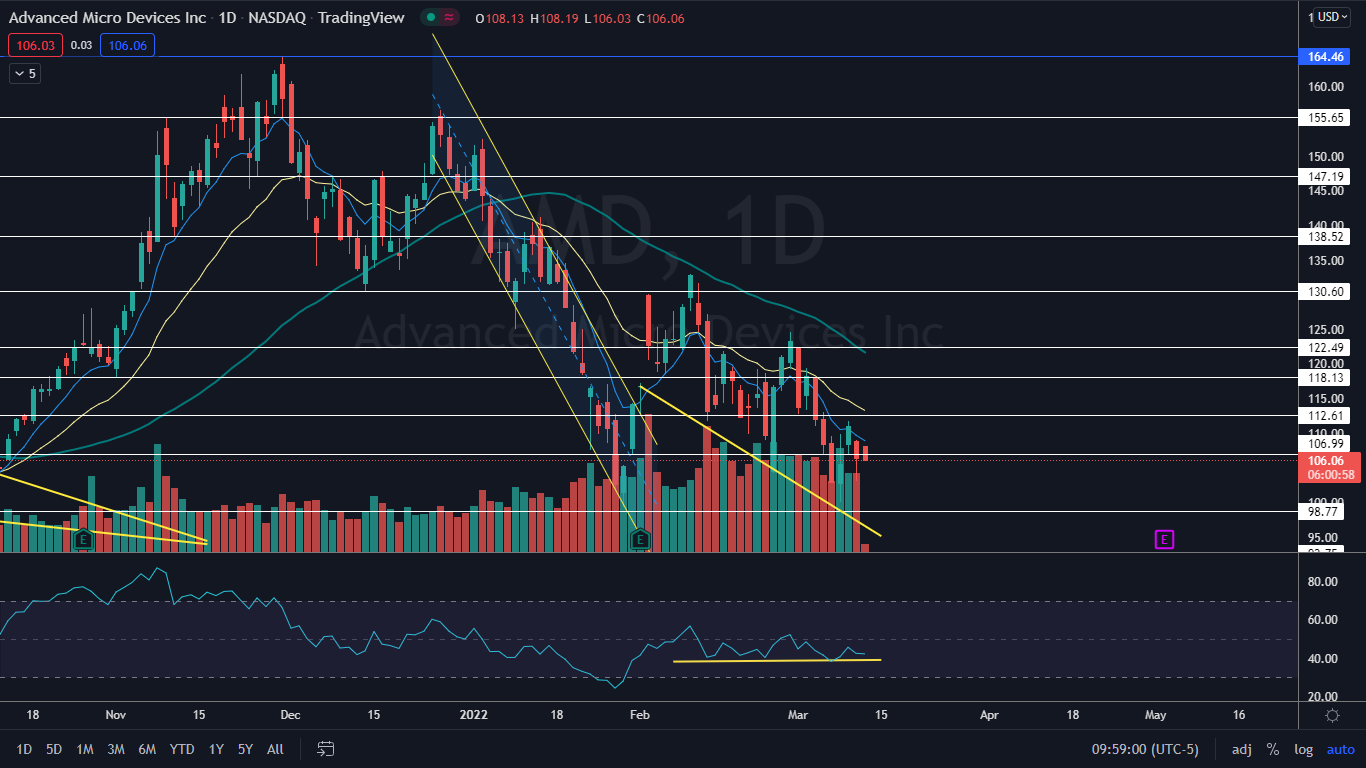
Advanced Micro Devices reached an all-time high of $164.46 on Nov. 30, 2021, and between that date and Jan. 28 of this year, the stock declined almost 40% before bouncing up slightly.
The heavy downward pressure on the stock has attracted bears and AMD is beginning to develop characteristics that could make the stock a candidate for a short squeeze.
Although AMD has a massive 1.19 billion share float, 52.85% of the available shares are held by institutions. The short interest on the stock has also been increasingly heavily, with the latest available data showing that the multinational semiconductor company has 88.71 million shares held short, meaning 5.47%. The number has increased from 63.84 million in January.
See Also: Why Apple, AMD, Microsoft And Nvidia Shares Are Falling Today
The AMD Chart: AMD began trading in a downtrend on Feb. 8 and has made a fairly consistent series of lower high and lower lows within the pattern. The most recent lower high was printed on March 9 at the $111.71 mark and the most recent lower low was formed at the $100.08 mark on March 8.
On Friday, AMD opened the trading day slightly higher than Thursday’s close but immediately ran into a group of sellers who dropped the stock down slightly. If AMD’s price action on Friday remains within Thursday’s range, the stock will print an inside bar pattern on the daily chart. The pattern, in this case, would be neutral and traders and investors can watch for a break up or down from Thursday’s mother bar later on Friday or on Monday to gauge future direction.
AMD has developed weak bullish divergence on the daily chart, where the stock has made a series of lower lows but the relative strength index has trended flat. Weak bullish divergence indicates a bounce is likely to come.
The stock is trading below the eight-day and 21-day exponential moving averages (EMAs), with the eight-day EMA trending below the 21-day, both of which are bearish indicators. AMD is also trading about 12% below the 50-day simple moving average, which indicates longer-term sentiment is bearish.
Want direct analysis? Find me in the BZ Pro lounge! Click here for a free trial.
- Bulls want to see big bullish volume come in and break AMD up above the eight-day EMA, which has been acting as heaving resistance since March 2. If the stock can regain the level as support, bulls would feel more comfortable going forward. There is resistance above the area at $112.61 and $118.13.
- Bears want to see big bearish volume come in and drop AMD down below the March 8 low of day, which will confirm the downtrend is still intact and cause the stock to lose an important psychological support level at $100. Below that level, there is further support at $98.77 and $92.75.