
The negative effects of the Federal Reserve’s interest rate hikes continue to hit the real estate investment trust (REIT) sector.
Essex Property Trust Inc. (NYSE:ESS) dropped 2.29% on Nov. 2, to a new 52-week low of $216.32. The REIT kicked off the year at $350, making for a 10-month decline of 38%.
With the 30-year fixed mortgage rate hovering above 7%, it’s become increasingly difficult for real estate-related investments to attract buying interest. Essex reported third-quarter funds from operations (FFO) on Oct. 26 of $3.69 per share versus the previous quarter’s $3.68 per share. How tough it may be for FFO numbers to increase is the question, given much higher interest rates.
The company derives income from 263 apartment rental properties containing over 62,000 units. It’s developing three more properties with 571 units. Essex does business on the West Coast, with a focus on urban and suburban properties in Southern California, Northern California and Seattle.
Following the release of the third-quarter results, Piper Sandler analyst Alexander Goldfarb downgraded his rating of the REIT from overweight to neutral, lowering his price target from $297 to $250. Analyst Brad Heffern of RBC Capital Markets maintains his outperform rating, lowering his price target from $288 to $265.
Essex has a market capitalization of $14 billion, making it a mid-sized player among New York Stock Exchange-traded REITs. It trades an average daily volume of 444,000 shares. The REIT is paying a dividend of 3.97%.
Here’s the daily price chart for Essex:
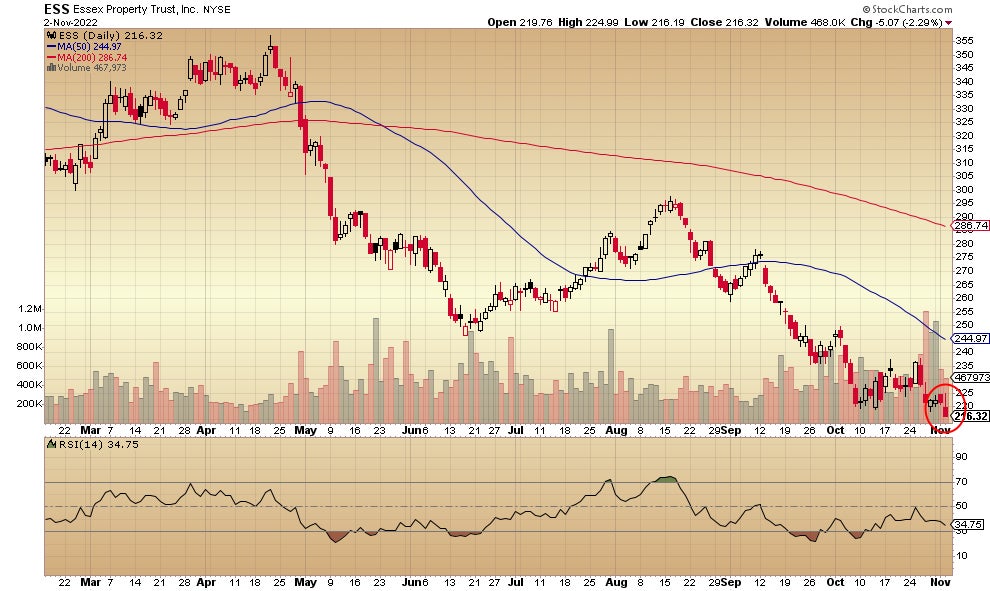
Note how the price dropped below the earlier October lows to a new 2022 low. The selling volume lessened from that which followed the release of the third-quarter FFO numbers. A positive divergence may be forming on the relative strength indicator (RSI) below the price chart. It’s a bearish look, however, for Essex to be trading below downtrending 50- and 200-day moving averages.
The weekly price chart looks like this:
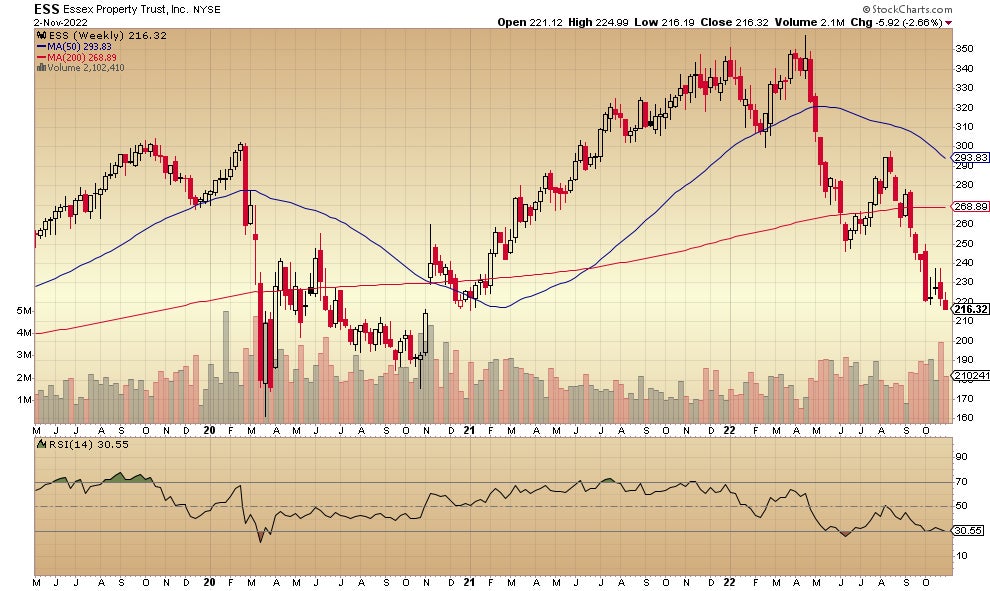
The price is back to the level of late 2021 and beginning to approach the range of the March 2020 pandemic scare. The 50-week moving average has turned down, a bearish indicator for trend analysts, and the 200-week moving average appears to be flattening instead of continuing higher.
See more on real estate investing from Benzinga:
-
This Little-Known REIT Is Producing Double-Digit Returns In A Bear Market: How?
-
There's No Bear Market For This Real Estate Fund... Up 11.7% YTD
- Read more...
Not investment advice. For educational purposes only.