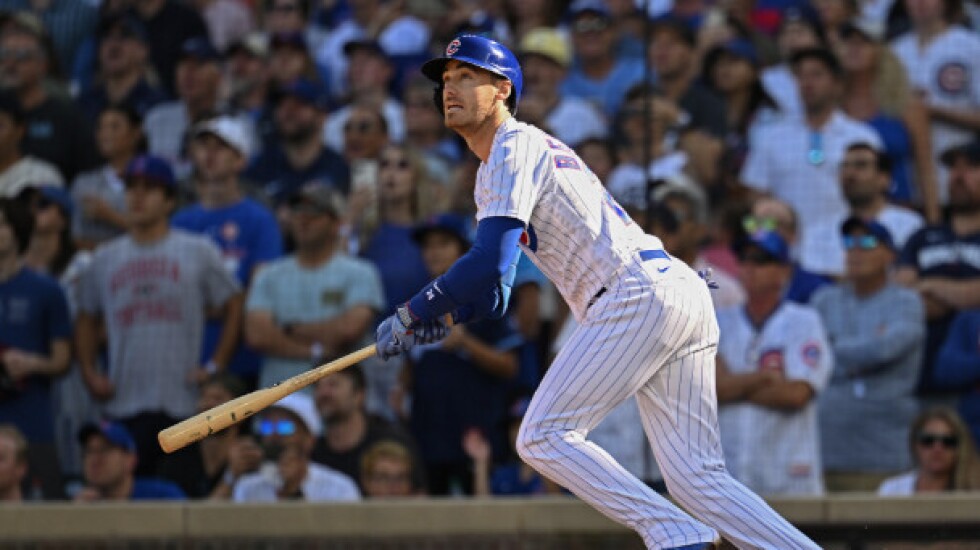
Cody Bellinger has been the Cubs’ leader in win probability added (WPA) this season, which shouldn’t come as any shock. He has led the way in most offensive categories.
By traditional Triple Crown stats, Bellinger’s .305 batting average, 26 home runs and 95 RBI top the Cubs. He leads them with a .531 slugging percentage and .886 OPS. His 135 weighted runs created plus tops Seiya Suzuki’s 125 for the team lead and ranks 12th in the majors.
In terms of WPA, Bellinger’s 2.53 leads Ian Happ’s 1.85, Nico Hoerner’s 1.61 and Mike Tauchman’s 1.26. A WPA of 1 represents adding 100% to the chance of winning one game.
WPA weighs how much each plate appearance adds or subtracts from a team’s probability of winning. A single in a blowout adds less to win probability than a single in a tight game. A single with two outs in the early innings adds less than a single with no one out in the late innings of a close one.
With the Cubs trailing 2-1 in the third inning of a 4-3 victory Sunday against the Rockies, Suzuki singled with two outs, moving Happ to second. That increased the Cubs’ chance of winning from 40.2% to 42.6% and tacked .024 onto Suzuki’s WPA.
With no one out and the Cubs trailing 3-1 in the sixth, Dansby Swanson singled to advance Suzuki to third. The Cubs’ chances of winning rose from 34.4% to 44.4%, and Swanson gained .10 in WPA. Adding the runner with no outs boosted the Cubs’ shot to win more than four times as much as the single with two outs in the third.
With the Dodgers, Bellinger posted 4.01 WPA in 2017 and 5.41 WPA in 2019 but slipped into negative numbers with minus-1.32 in 2021 and minus-1.33 in 2022.
Batting behind hitters who get on base yields more chances to add WPA. At Fangraphs.com, a leverage index (LI) weighs chances to add WPA, and dividing WPA by LI puts hitters on level ground.
Bellinger remains the Cubs’ leader in WPA/LI with 3.42 to 1.29 for Tauchman, 1.26 for Happ, 1.25 for Suzuki and 1.19 for Hoerner.
Fangraphs’ win probability pages include a column labeled ‘‘clutch.’’ WPA in average situations is subtracted from WPA in high-leverage situations to measure whether a player raises his output when the game is on the line.
There, Bellinger is not the team leader. Happ tops the Cubs at .67, followed by Hoerner at .49 and Yan Gomes at .46.
Bellinger’s minus-.89 means he has hit better in average situations than with high leverage. Baseball-Reference.com shows Bellinger’s OPS dipping to .740 in high-leverage times.
‘‘Clutch’’ compares a player to himself. A good hitter with negative clutch usually is better in high-leverage times than a weak hitter with positive clutch. Bellinger is better this season than when he had a .599 OPS in high-leverage situations but had a .36 clutch.
For Bellinger, average production this season has been a high bar to clear, with his win probability an important reason the Cubs remain in playoff contention in the final week.