Apple, Inc (NASDAQ:AAPL) opened slightly higher on Monday in tandem with the S&P 500, which gapped up and was trading about 0.7% higher at press time.
According to a report on Sunday, the tech giant may be just months away from debuting its MacBook Pro laptops with M2 Pro and M2 Max processors. While the updated CPUs could help boost sales for the tech giant in the lead up to the holiday buying season, the quicker-than-anticipated launch may frustrate customers who would find their M1 Pro and M1 Max models, which debuted in the fall of 2021, have become out of date earlier than expected.
During a time when many companies are doing everything they can to entice buyers to purchase non-essentials in order to thwart declining revenues, the release of new products sooner-than-expected may make sense. Traders and investors will be watching Apple closely when the company prints its third-quarter financial results on July 28 to see if the tech giant has begun to suffer amid the recent economic downturn.
Apple’s stock has shown strength recently despite soaring inflation and a series of interest rate hikes, two events which would usually cause concern amongst investors. Although the stock is down about 17% from the Jan. 4 all-time high of $182.94, Apple reversed into an uptrend on June 17 and has gained about 16% since that date.
Want direct analysis? Find me in the BZ Pro lounge! Click here for a free trial.
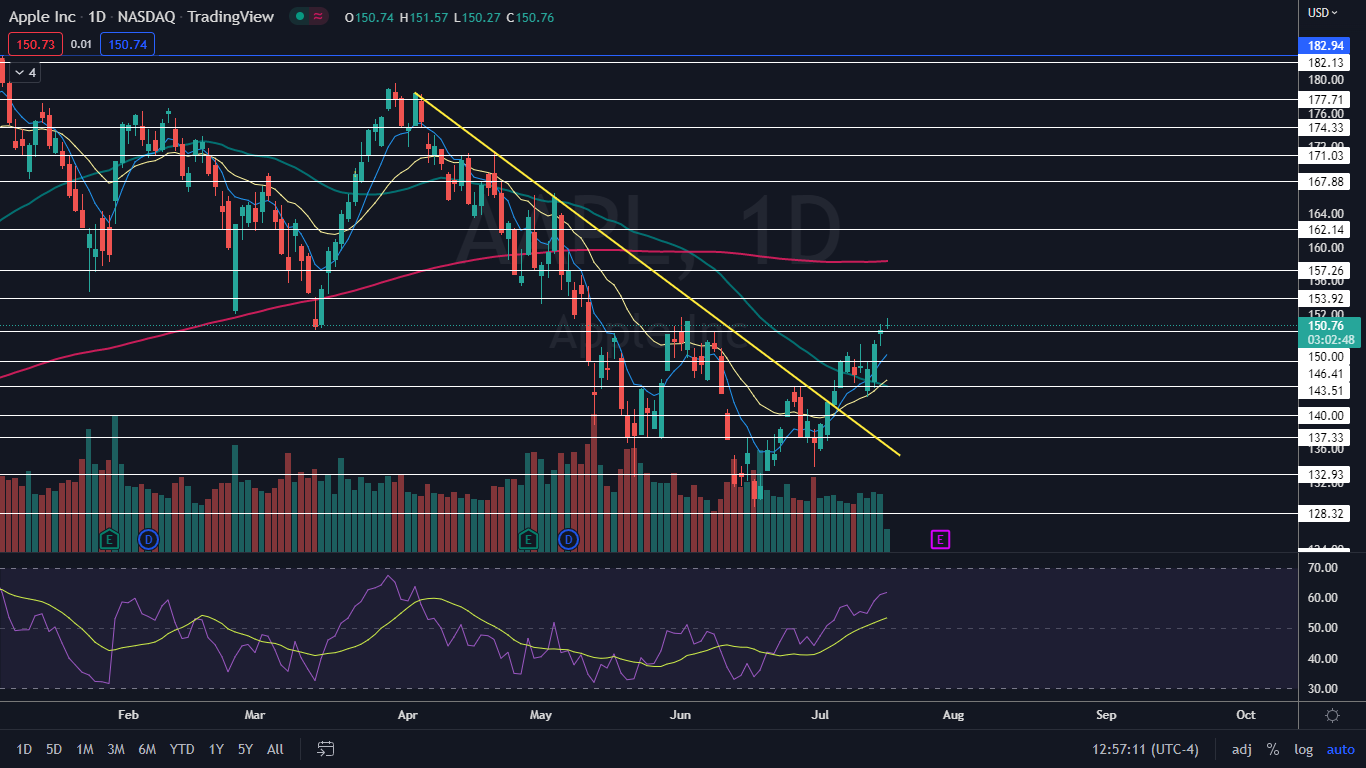
The Apple Chart: Apple has been trading in a fairly consistent uptrend, with the most recent confirmed higher high printed on June 12 at $148.45 and the most recent low formed at the $142.12 level on July 13. On Monday, Apple spiked up above the most recent higher high and may have formed the next high within the pattern.
- If Apple closes the trading session flat or near its low-of-day price, the stock will print a doji or shooting star candlestick, respectively, which could indicate the next higher high is in and Apple will trade lower on Tuesday. If that happens, bullish traders can watch for the stock to print a reversal candlestick, such as another doji candlestick or a hammer candlestick above the most recent low, which could indicate the uptrend will continue.
- Bearish traders want to see increasing bearish volume come in and drop Apple down to print a lower low, which could indicate a new downtrend will take place. On Monday, Apple’s trading volume was measuring in at about 30 million compared to the 10-day average of 71.53 million, which indicates either consolidation or indecision.
- Apple has resistance above at $153.92 and $157.26 and support below at $150 and $146.41.
See Also: Why This Apple Analyst Thinks New iPad Multitasking System Is 'Convoluted And Confusing'