
It hasn’t been this bad for growth stocks in 20 years, since the dot-com boom and bust.
If the ARK Innovation ETF (ARKK) was around then, it would have likely experienced moves similar to the ones we’re seeing today.
The fund's shares are now trading below the 2020 covid low of $33, as the ETF is now down more than 80% from its peak. That’s brutal.
For what it’s worth, the Nasdaq Composite suffered a peak-to-trough decline of 78.4% and the Invesco QQQ ETF (QQQ) fell 84% during the dot-com bust.
While the market surely has ebbed and flowed over the past two decades, those moves have been more extreme for growth stocks. That’s just how it is.
When the Fed is accommodative and the economy is strong, growth stocks rip and valuations struggle to hold the stock prices in check.
But when the Fed is tightening with a restrictive monetary policy and the economy is weakening, growth stocks fail miserably.
The main reason? They don’t have the profits or cash flow to support their stock prices like some of the more well-established businesses out there.
The growth stocks that do have profits can be evaluated on an earnings basis, but just like a bull market in reverse, valuation does little to support the stock prices in a bear market.
With all that in mind, let’s look at the leading growth-stock proxy in the market, which is the ARKK ETF.
Trading ARKK Stock
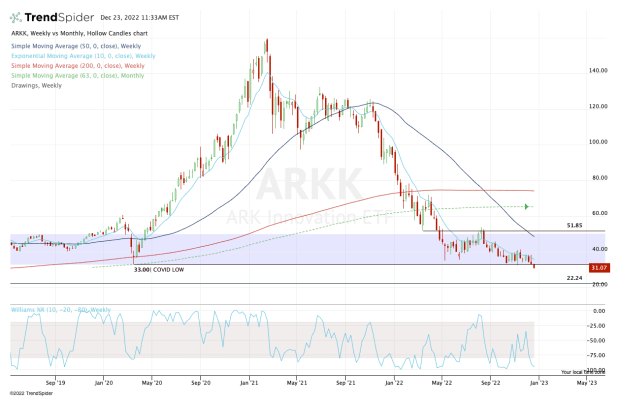
Chart courtesy for TrendSpider.com
Three of ARKK’s four largest holdings — Tesla (TSLA), Roku (ROKU) and Zoom Video (ZM) — made new 52-week lows on Thursday. So, not surprisingly, did ARKK.
But the technicals provide a reason to believe that ARKK may be near some sort of trough. ARKK might in fact bottom before the calendar hits 2023.
But still the trends are not very supportive of that theory, unless we get a much larger rotation to the upside.
That starts by the stock reclaiming $33 and the declining 10-week moving average on the chart above. At the very least, that will put ARKK above active resistance (the 10-week) and back above a key level (the covid low and recent support).
Depending on the strength of the rally, that could put the 50-week and 10-month moving averages in play, along with the $50 to $52 area.
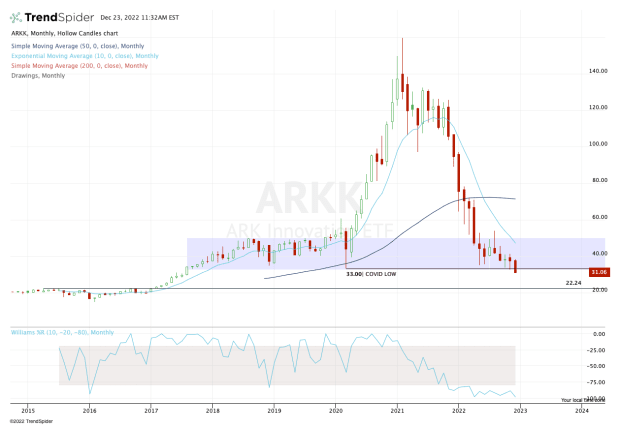
Chart courtesy of trendSpider.com
What happens if ARKK can’t reclaim $33? Or worse, if it becomes resistance?
On the monthly chart, one can see the clean break of $33 so far in December. If ARKK reclaims this level, traders could have a reversal to work with, but so long as it’s below $33, the bulls must be careful.
Ultimately, it could open the door down to the $22 to $22.50 area. I know it seems extreme — it would equate to an 86% peak-to-trough decline — but that’s where ARKK could land if the selling pressure hits an extreme level.
The bottom line: Keep an eye on $33 and the 10-week moving average.