Tilray, Inc (NASDAQ:TLRY) was trading over 5% higher at one point on Friday as traders and investors continued to await a House vote on the Marijuana Opportunity Reinvestment and Expungement (MORE) act, which was originally expected to take place this week.
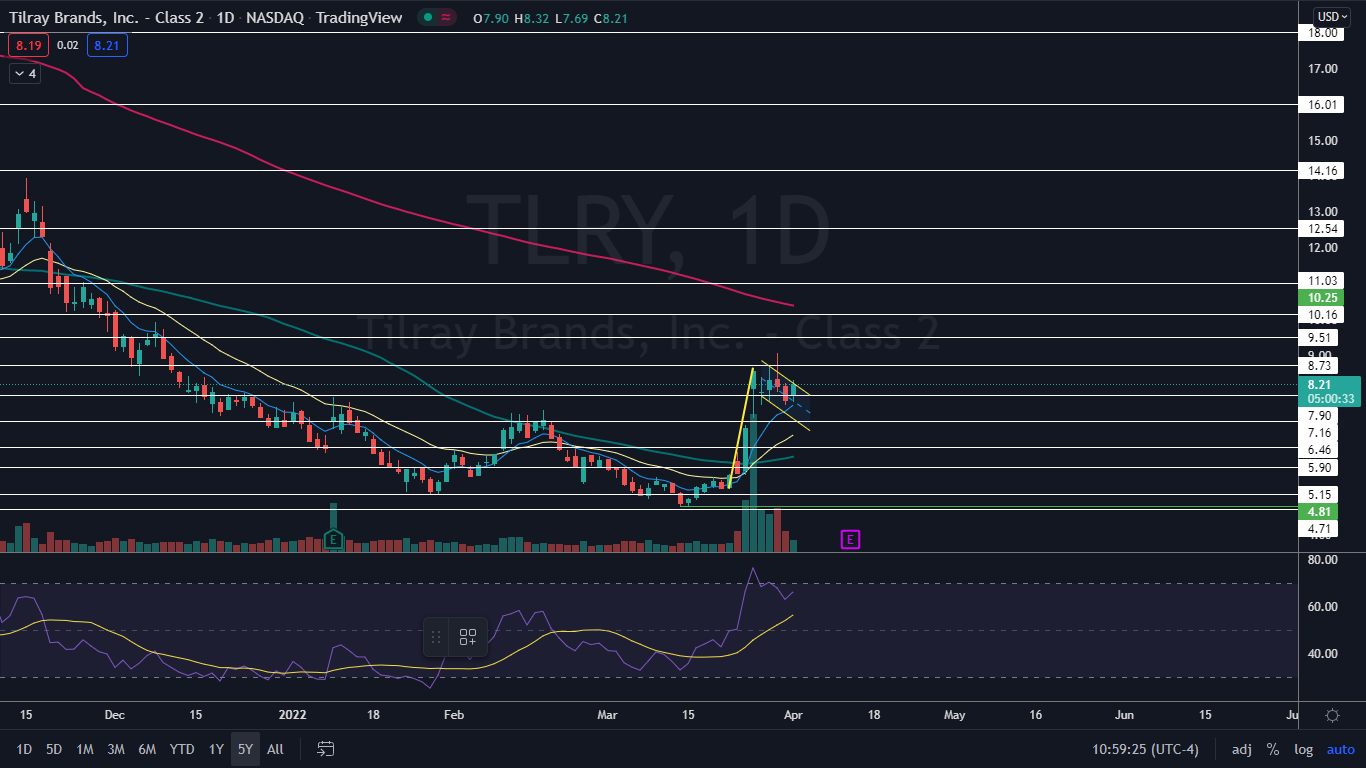
The debate continues but when news of the vote hit on March 24, Tilray soared 27% higher, which was followed by an additional 22% surge the following trading day. The rise higher paired with the week-long consolidation has settled Tilray into a bull flag pattern on the daily chart.
The bull flag pattern is created with a sharp rise higher forming the pole, which is then followed by a consolidation pattern that brings the stock lower between a channel with parallel lines.
- For bearish traders, the "trend is your friend" (until it's not) and the stock may continue downwards within the following channel for a short period of time. Aggressive traders may decide to short the stock at the upper trendline and exit the trade at the lower trendline.
- Bullish traders will want to watch for a break up from the upper descending trendline of the flag formation, on high volume, for an entry. When a stock breaks up from a bull flag pattern, the measured move higher is equal to the length of the pole and should be added to the lowest price within the flag.
A bull flag is negated when a stock closes a trading day below the lower trendline of the flag pattern or if the flag falls more than 50% down the length of the pole.
Want direct analysis? Find me in the BZ Pro lounge! Click here for a free trial.
The Tilray Chart: The pole of Tilray’s bull flag pattern was created between March 22 and March 25 and the flag was formed over the trading days that have followed. If the pattern is recognized, the measured move is about 62%, which indicates Tilray could soar up toward the $13 level in the future.
- Traders can watch for a break up from the flag pattern on higher-than-average volume to gauge whether the bull flag pattern was recognized.
- Tilray is also trading in an uptrend pattern on the daily chart, with the most recent higher low printed at the $7.62 level on March 31 and the most recent higher high printed on March 30 at the $9.08 level. If Tilray confirms a break up from the bull flag, it’s likely to also print its next consecutive higher high.
- If Tilray closes the trading day near its high-of-day price, it will print a bullish Marubozu candlestick, which could indicate higher prices and a break from the bull flag are in the cards for Monday, if the stock doesn’t break up from the formation later on Friday.
- Tilray has resistance above at $8.73 and $9.51 and support below at $7.90 and $7.16.