Palantir Technologies Inc (NYSE:PLTR) was shooting up almost 6% on Wednesday after opening slightly lower. The stock was moving in tandem with the general markets, which saw the S&P 500 rising about 0.6%.
Palantir has shown strength in comparison to the S&P 500 recently, soaring about 22% in a confirmed uptrend since June 13, while the S&P 500 remains trading in a downtrend.
An uptrend occurs when a stock consistently makes a series of higher highs and higher lows on the chart.
The higher highs indicate the bulls are in control while the intermittent higher lows indicate consolidation periods.
Traders can use moving averages to help identify an uptrend, with rising lower time frame moving averages (such as the eight-day or 21-day exponential moving averages) indicating the stock is in a steep shorter-term uptrend.
Rising longer-term moving averages (such as the 200-day simple moving average) indicate a long-term uptrend.
A stock often signals when the higher high is in by printing a reversal candlestick such as a doji, bearish engulfing or hanging man candlestick. Likewise, the higher low could be signaled when a doji, morning star or hammer candlestick is printed. Moreover, the higher highs and higher lows often take place at resistance and support levels.
In an uptrend the "trend is your friend" until it’s not and there are ways for both bullish and bearish traders to participate in the stock:
- Bullish traders who are already holding a position in a stock can feel confident the uptrend will continue unless the stock makes a lower low. Traders looking to take a position in a stock trading in an uptrend can usually find the safest entry on the higher low.
- Bearish traders can enter the trade on the higher high and exit on the pullback. These traders can also enter when the uptrend breaks and the stock makes a lower low indicating a reversal into a downtrend may be in the cards.
Want direct analysis? Find me in the BZ Pro lounge! Click here for a free trial.
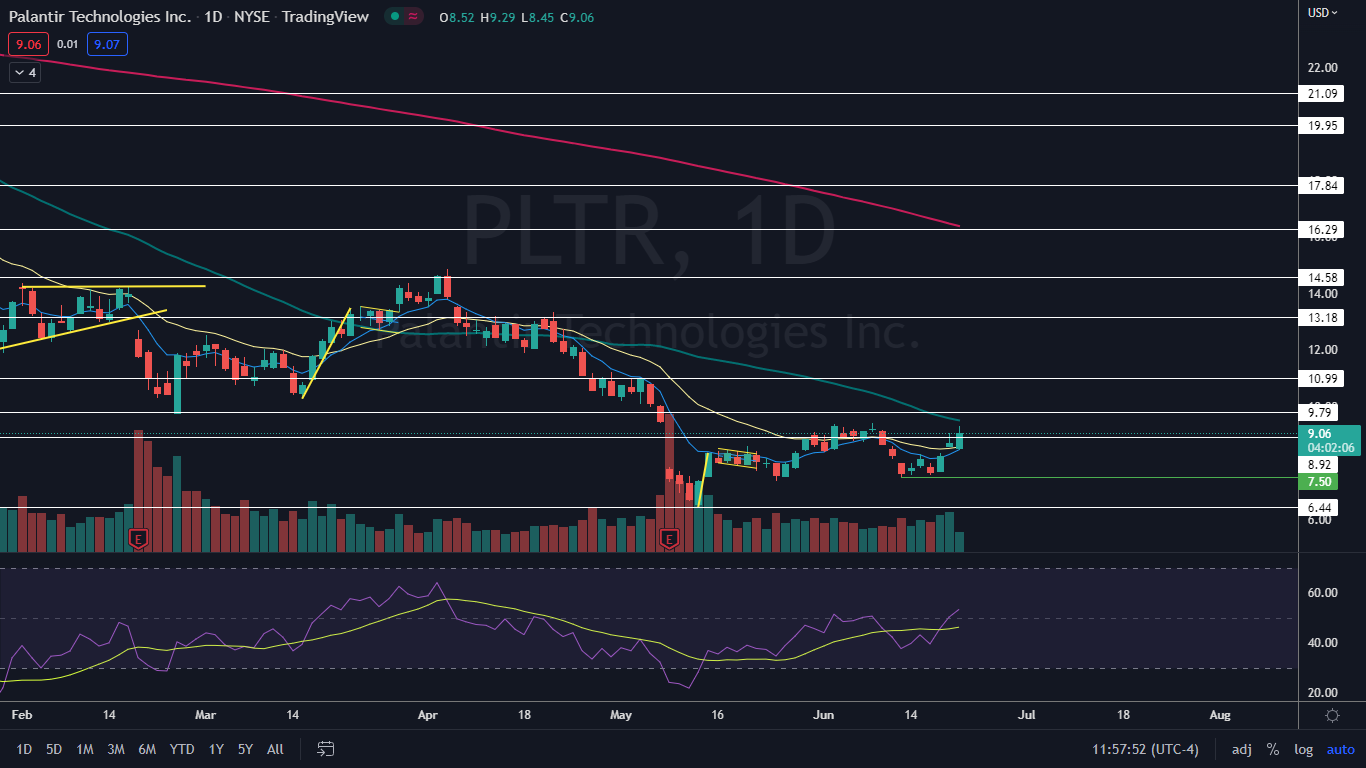
The Palantir Chart: Palantir’s most recent higher low in uptrend was printed on July 16 at $7.58 and the most recent confirmed higher high was formed at the $9.29 mark on Wednesday when the stock rose to its high-of-day. If the stock trades higher again on Thursday, Wednesday’s low-of-day may print as the next higher low.
- Palantir is likely to trade higher on Thursday because the stock was working to print a bullish engulfing candlestick on the daily chart. A bullish engulfing candlestick occurs when a stock’s daily candle completely envelops the previous day’s candlestick, to close near the high-of-day.
- If Palantir closes the trading session with a long upper wick, the stock will print a shooting star candlestick, which could indicate lower prices are on the horizon. If that happens, traders can watch for a reversal candlestick to form above the last higher low in order to take a position.
- Palantir is trading above the eight-day and 21-day exponential moving averages (EMAs) and if the stock is able to remain above the 21-day EMA for another day or two, the eight-day EMA will cross above the 21-day, which would be bullish.
- Palantir has resistance above at $9.79 and $10.99 and support below at $8.92 and $7.50.
See Also: Geopolitical Tensions Are Risky For Some AI Companies, But Not Palantir Technologies, BofA Says
Photo: rafapress via Shutterstock