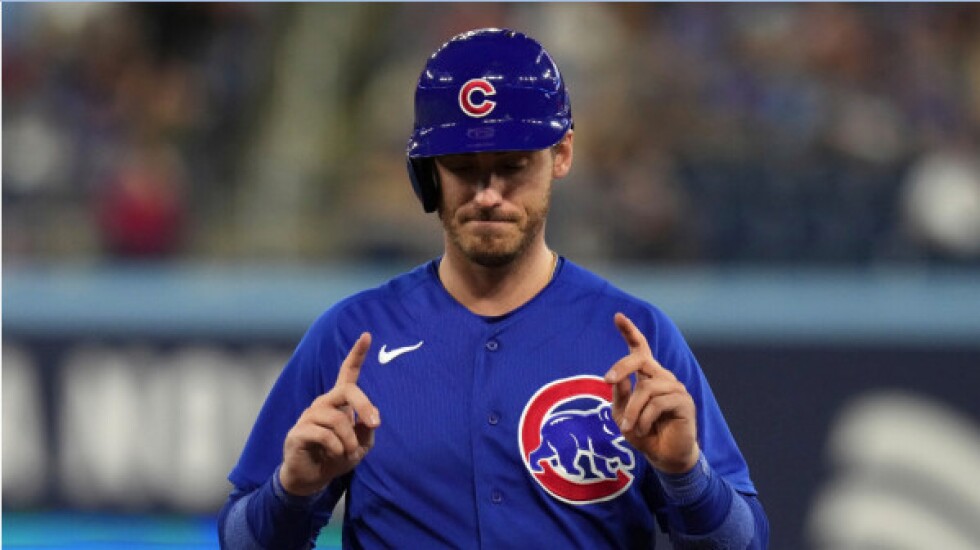
Add Cubs center fielder Cody Bellinger’s .379 on-base percentage and .556 slugging percentage, and he has a .935 OPS that ranks eighth among major-leaguers with at least 300 plate appearances.
But by OPS+, as calculated at Baseball-Reference.com, Bellinger (147) trails the Padres’ Juan Soto (155) and the Rays’ Yandy Diaz (154), even though Bellinger leads Soto by 20 OPS points and Diaz by 21.
Similarly, center fielder Luis Robert Jr. leads the White Sox with an .889 OPS, 14th in the majors. But his 138 OPS+ is only one point better than that of the Rays’ Isaac Paredes, whose OPS is .856.
OPS+ uses OPS as a base, so how can it indicate more value in a player with a lower OPS?
It’s because OPS+ is adjusted for ballparks and opposition. A player with more plate appearances in tougher hitters’ parks or who has played opponents that allow less offense will get an upward adjustment in OPS+.
Once adjustments are made, OPS+ is put on scale where 100 indicates a league-average hitter. Given his ballparks and opposition, Bellinger has been 147% as productive as an average hitter. Robert has been 138% as productive.
The adjustments put OPS into context. In parks that are tougher on hitters, each run is a bigger step toward winning. An .800 OPS is more valuable where the average score is 4-3 than where it is 5-4.
Baseball Savant at MLB.com averages three seasons for its park factors. For 2021-23, Guaranteed Rate Field is right on average at 100 and Wrigley Field slightly favors hitters at 102.
The Padres’ Petco Park, where Soto plays, and the Rays’ Tropicana Field, home for Diaz and Paredes, are pitchers’ parks at 95. The only park friendlier to pitchers is the Mariners’ T-Mobile Park at 93, while the most extreme hitters’ park is the Rockies’ Coors Field at 111.
Soto, Diaz and Paredes get positive adjustments for production in pitchers’ parks. But the Rockies’ Ryan McMahon, with a .796 OPS that matches that of the Blue Jays’ Matt Chapman, trails 120-104 in OPS+.
Road parks count, so teammates who play different games can have different adjustments. The Cubs’ Patrick Wisdom has a small OPS edge over Dansby Swanson, .790-.787, but Swanson has a 109-106 lead in OPS+.
Because 100 is always average, OPS+ can be used to compare players across eras. Aramis Ramirez, a Cubs third baseman in 2003-11, had an .887 OPS, fourth among Cubs with at least 3,000 plate appearances. Kris Bryant was a point behind at .886 in 2015-21, but runs were a little harder to come by in Bryant’s era, so Bryant leads 133-126 in OPS+.
Both are well ahead of 1960s and ’70s star Billy Williams (.867) in OPS. But Williams played through the 1963-68 era of the expanded strike zone, when runs were scarce, and his 135 OPS+ tops Bryant’s and Ramirez’s.
OPS+ doesn’t correlate to runs quite as well as more complex calculations, such as weighted runs created-plus. Still, it’s light-years beyond batting average, easy to understand and puts OPS into context among different teams and eras.


