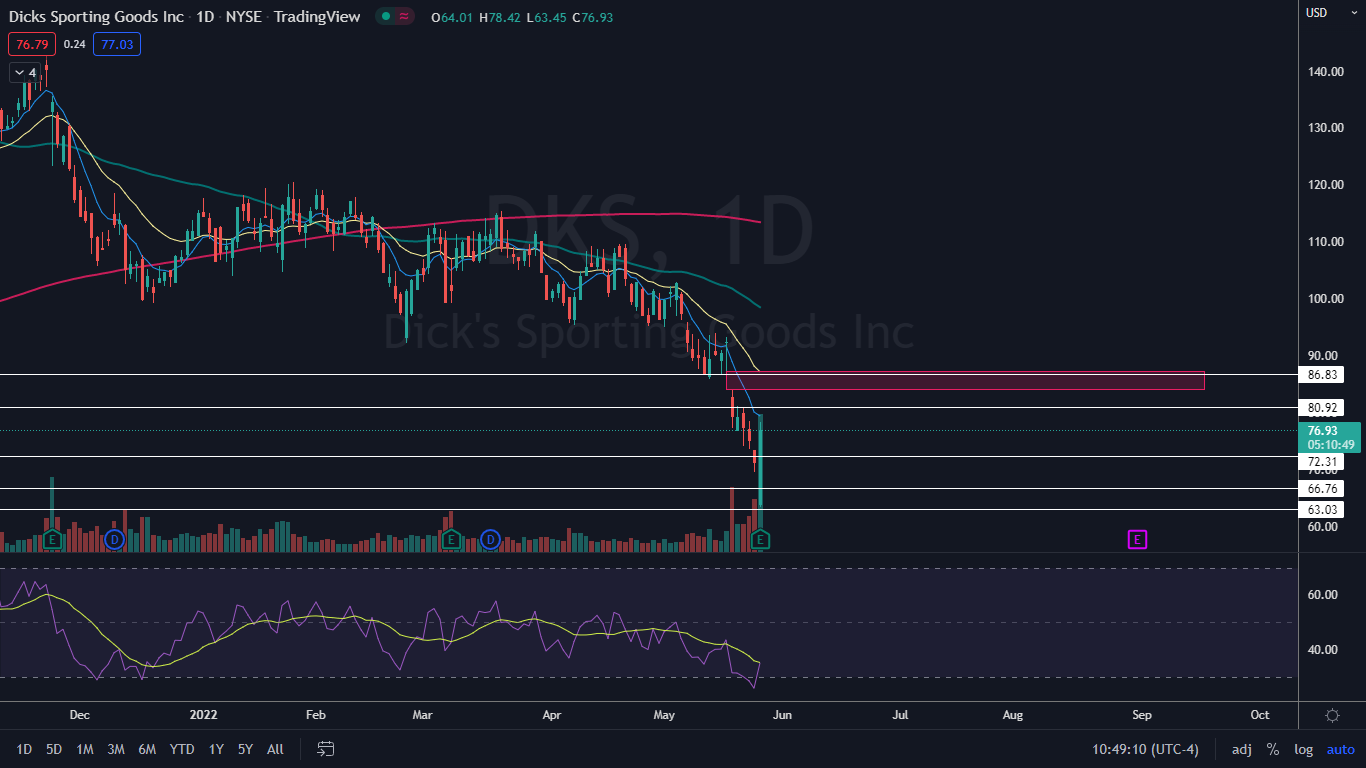
Dick’s Sporting Goods, Inc (NYSE:DKS) gapped down about 10% lower on Wednesday to reach a new 52-week low of $63.45, before bulls came in and bought the dip.
In the premarket Wednesday Dick’s Sporting Goods printed its first-quarter financial results. For the quarter, the company reported adjusted earnings of $2.85 per share on revenues of $2.7 billion, which beat the consensus estimate of EPS of $2.47 on revenues of $2.59 billion.
The company issued weak guidance for 2022, which caused the stock to gap down but at press time, the sporting goods retailer was soaring up over 20% off the open, and working to print a massive bullish engulfing candlestick.
A bullish engulfing candlestick pattern forms when a small red candlestick is followed by a large green candlestick that has a body that completely engulfs the body of the previous day’s candlestick.
For the pattern to be valid, the engulfing candlestick must close above the highest price of the previous day’s candlestick and the pattern is more powerful if it is preceded by a number of red candles.
A bullish engulfing candlestick pattern is often found at the bottom of a downtrend and can be a powerful reversal signal that the stock will begin to trade in an uptrend.
Candlestick patterns can be used to indicate the future price direction of a stock. Candlestick patterns are especially useful for technical traders when they are combined with other indicators such as larger patterns, trading volume, relative strength index (RSI) and divergences between RSI and price action.
Want direct analysis? Find me in the BZ Pro lounge! Click here for a free trial.
The Dick’s Sporting Goods Chart: Dick’s Sporting Goods has been trading in a steep downtrend since March 21, when the stock attempted to regain support at the 200-day simple moving average (SMA) and failed. The 200-day SMA is a bellwether indicator that is used to suggest whether a stock is in a bullish or bearish cycle.
- Although Dick’s Sporting Goods was soaring on Wednesday, the stock is a long way from negating its downtrend. The most recent lower high was printed on May 17 and $93.36 and the most recent lower low was printed at the low-of-day on Wednesday. In order to reverse trend, Dick’s Sporting Goods will need to shoot up over the most recent lower high or consolidate downward over the coming days to print a higher low.
- Dick’s Sporting Goods has a gap above between $83.94 and $87.31. Gaps on charts fill about 90% of the time, which indicates the stock is likely to rise up into the empty range in the future. If Dick’s Sporting Goods soars up to fill the gap, it will represent an additional 13% increase from the current share price.
- If Dick’s Sporting Goods closes the trading session near its high-of-day price, it’s likely higher prices may come again on Thursday. If the stock closes the trading day with a long upper wick, the stock may trade lower, likely to form an inside bar in consolidation.
- Dicks Sporting Goods has resistance above at $80.92 and $86.83 and support below at $72.31 and $66.76.
See Also: How to Read Candlestick Charts for Beginners
Photo: Anthony92931, via Wikimedia Commons