Apple, Inc (NASDAQ:AAPL) was trading about 1.5% lower on Tuesday after a bearish day on Monday saw the stock gap down 1.5% and close the trading session flat.
The tech-giant is battling with the 200-day simple moving average (SMA), which is a bellwether indicator used by technical analysts to determine whether a security is trading in a bull or bear market.
During the latest short-lived bull cycle in the S&P 500, which took place between July 14 and Aug. 16, Apple was one of only three stocks in the S&P 500’s top 10 holdings to trade above the 200-day SMA. The exceptions were Tesla, Inc (NASDAQ:TSLA), which regained the area briefly, and United Health Group, Inc (NYSE:UNH), which crossed above the indicator on June 21.
A loss of the 200-day SMA may spook bullish Apple traders, although those looking to enter into a position may prefer to see the lower gap close completely.
Want direct analysis? Find me in the BZ Pro lounge! Click here for a free trial.
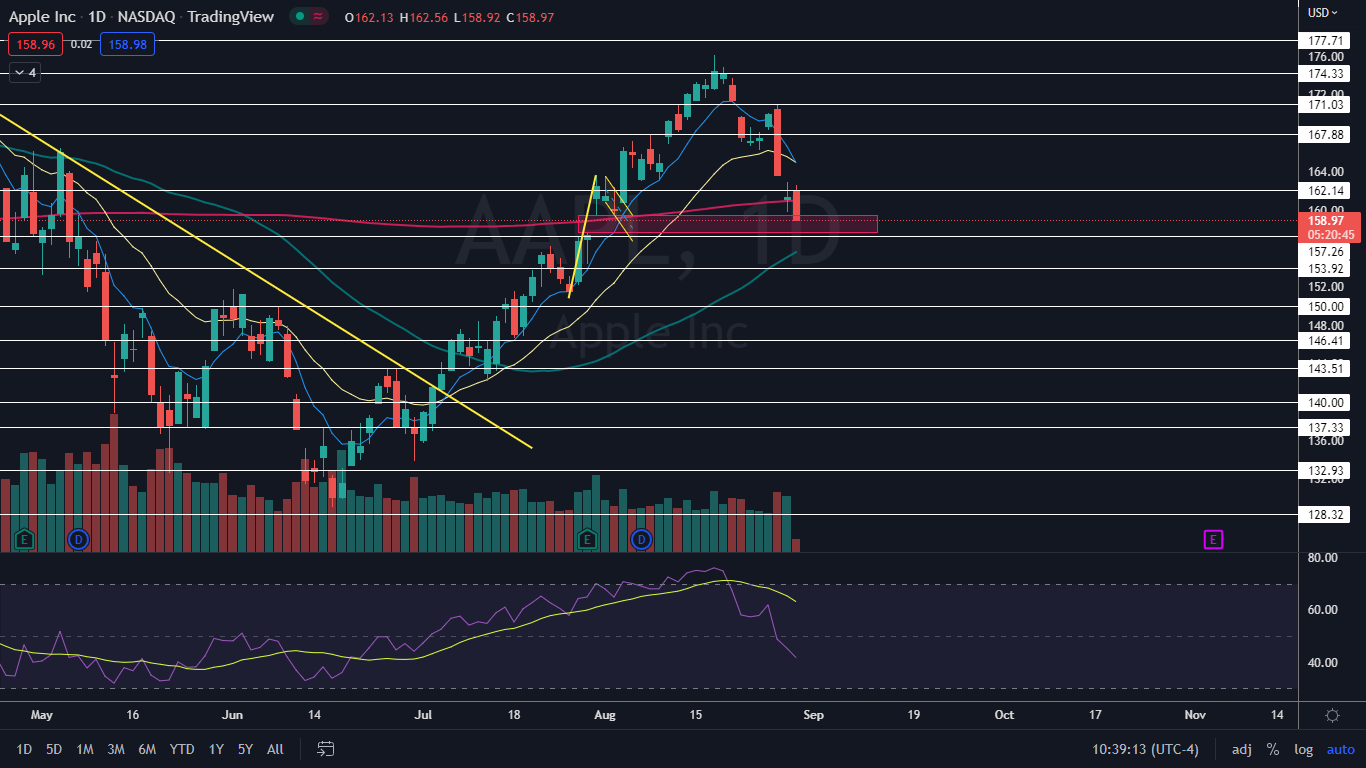
The Apple Chart: Apple opened slightly higher on Tuesday, but immediately ran into a group of sellers, who knocked the stock down below Monday’s low-of-day. The trading action has caused Apple to break bearishly from an initial inside bar, which leaned bearish because the stock was trading lower before forming the pattern.
- The lower gap exists between $157.64 and $159.50 and is about 90% likely to fill, Bullish traders usually prefer to not have gaps below, especially when the empty range is close by.
- Apple is trading in a confirmed downtrend, with the most recent lower high formed on Friday at $171.05 and the most recent confirmed lower low printed at the $166.25 level on Aug. 24. If Apple bounces up on Tuesday to form a candlestick with a lower wick, the stock may trade higher on Wednesday, which will cause Tuesday’s low to be the next lower low within the pattern.
- Just below the gap, the 50-day SMA is trending in an upwards direction. If Apple fills the gap and continues downwards, the 50-day SMA is likely to act as, at least, temporary support. Bullish traders can watch for a reversal candlestick, such as a doji or hammer candlestick, to form at the lower range of the gap or at the 50-day SMA to indicate the stock is about to bounce.
- Apple has resistance above at $162.14 and $167.88 and support below at $157.26 and $153.92.