HP Inc (HPQ) is hitting session lows on the day, off about 7% at last check.
The decline comes after the technology company reported earnings yesterday after the close and the results weren’t that inspiring.
Revenue fell about 4% year over year to $4.7 billion and missed analysts’ expectations by roughly $1 billion. Ordinarily, that would crush a stock. Surprisingly, the earnings of $1.04 a share grew almost 20% year over year.
Investors might be willing to overlook the revenue shortfall in lieu of the strong earnings results, but adjusted earnings were not as strong and the company cut its guidance.
Also hurting is that the overall market continues to swoon, as some investors fear that the low is not in yet.
Where the chart is concerned, let’s look at the post-earnings dip and where support may come into play.
Trading HPQ Stock
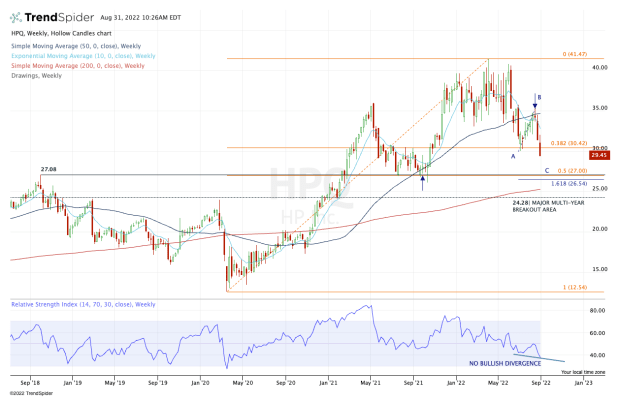
Chart courtesy of TrendSpider.com
At one point this summer, HP Inc. shares rallied in four straight weeks and in five out of six weeks. But the stock could not reclaim the 50-week moving average, a former support level.
With the continued move lower, we have an ABC-type correction underway — and two very clear levels to keep an eye on.
The first level is on the upside, at $30. This area marked the prior 2022 low and if HPQ stock can reclaim this level, the bulls could be long against this week’s low as a reasonable stop-loss. That would put the 10-week moving average in play as the first upside target.
Short of a rebound, investors in HP Inc. may want to beware of more potential downside.
Our second area of interest is $26.50 to $27.50. That zone is the 50% retracement from the 2022 high down to the 2020 low. It’s also the 161.8% downside extension of the current correction.
It’s a significant Fibonacci level for both the long-term and current ranges.
If that zone doesn’t hold as support, we need to start looking at the $24.50 to $25 level. That’s where we find the 200-week moving average and the prior multiyear breakout zone.
Trading HPE Stock
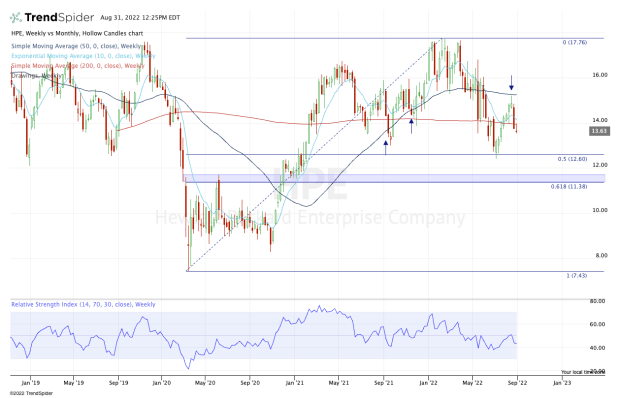
Chart courtesy of TrendSpider.com
While we’re looking at HP Inc., let's also review Hewlett Packard Enterprise (HPE).
Just like HP Inc., this stock is struggling with its 50-week moving average. From here, I want to see how HPE stock handles the $14 to $14.25 level.
So far this week, this zone has been resistance, but it’s also where we find the 10-week and 200-week moving averages. A push up through this zone opens the door to the August high of $15.20, as well as the 50-week moving average.
On the downside, the $12.50 area is critical. This zone marks the current 2022 low, as well as the 50% retracement.
A break of this zone opens the door down to the $11.50 area, with the significance of this area noted on the chart above.