Shiba Inu (CRYPTO: SHIB) attempted to break up from Sunday’s 24-hour trading range on Monday but ran into a group of sellers who knocked the crypto down into a tight range.
For the last four 24-hour sessions, Shiba Inu, dubbed "the Dogecoin Killer," has been trading within the Oct. 13 range, which has settled the crypto into a quadruple inside bar pattern on the chart.
Inside bar patterns indicate a period of consolidation and are usually followed by a continuation move in the direction of the trend.
An inside bar pattern has more validity on larger time frames (four-hour chart or larger). The pattern has a minimum of two candlesticks and consists of a mother bar (the first candlestick in the pattern) followed by one or more subsequent candles. The subsequent candle(s) must be completely inside the range of the mother bar and each is called an "inside bar."
A double, or triple inside bar can be more powerful than a single inside bar. After the break of an inside bar pattern, traders want to watch for high volume for confirmation the pattern was recognized.
- Bullish traders will want to search for inside bar patterns on stocks that are in an uptrend. Some traders may take a position during the inside bar prior to the break, while other aggressive traders will take a position after the break of the pattern.
- For bearish traders, finding an inside bar pattern on a stock that's in a downtrend will be key. Like bullish traders, bears have two options for where to take a position to play the break of the pattern.
- For bearish traders, the pattern is invalidated if the stock rises above the highest range of the mother candle.
Want direct analysis? Find me in the BZ Pro lounge! Click here for a free trial.
The Shiba Inu Chart: Shiba Inu showed a high level of volatility on Oct. 13, jumping up and down between $0.00000924 and $0.00001081. Since then, Shiba Inu has been trading within that range while tightening into a possible triangle pattern.
- On Monday, when the crypto attempted to break up from Sunday’s trading range, the crypto also attempted to break up from the triangle but failed. Traders can watch for higher-than-average volume to come in later on Monday or on Tuesday to break Shiba Inu up from the pattern; otherwise, the triangle will be invalidated.
- The inability for Shiba Inu to break from the triangle pattern is due lower-than-average volume. On Monday, Shiba Inu’s volume was measuring in at about 616.3 billion on Coinbase compared to the 10-day average of 1.5 trillion. Decreasing volume is often followed by an uptick in volume, which could eventually help the crypto choose a direction, depending on whether the volume surge is bullish or bearish.
- Shiba Inu has resistance above at $0.00001081 and $0.00001178 and support below at $0.00000975 and $0.00000856.
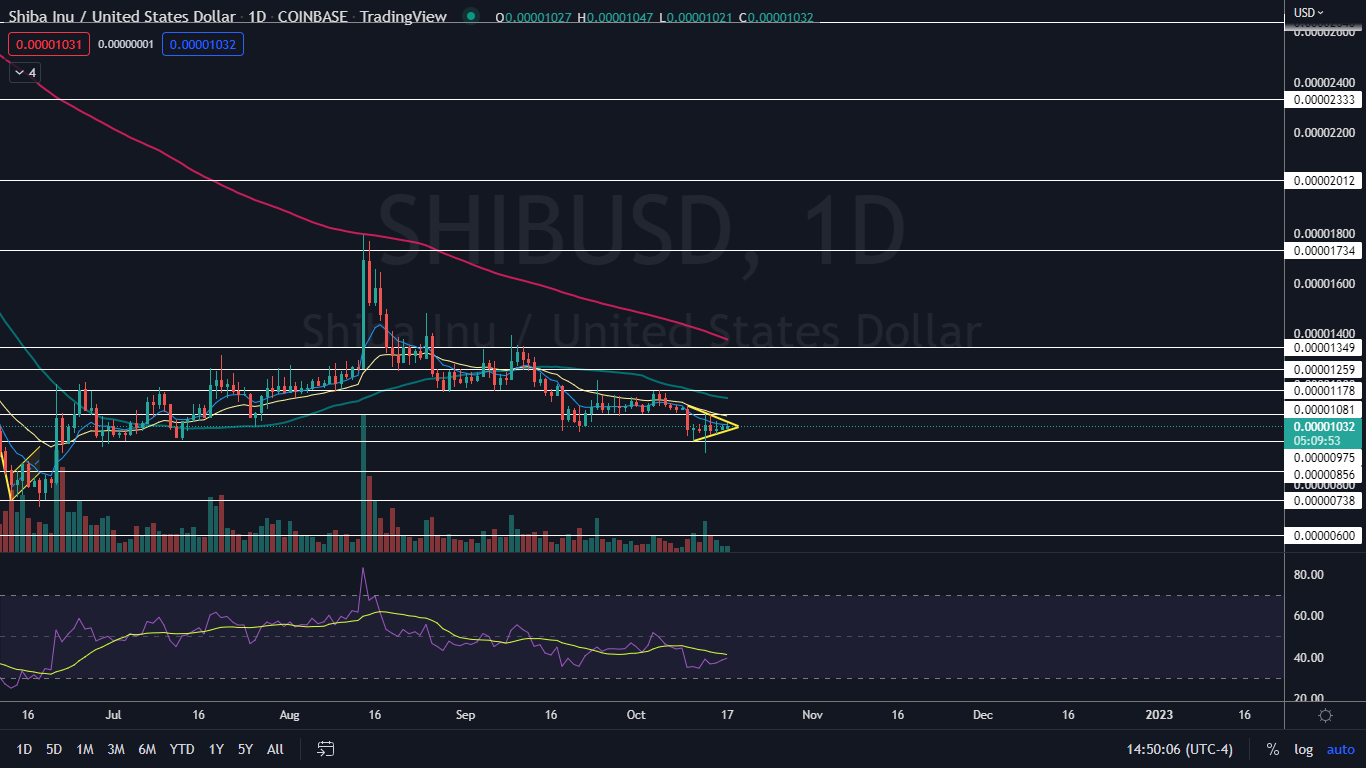
Photo via Shutterstock.