Meta Platforms, Inc (NASDAQ:FB) gapped up 2.76% on Monday in tandem with Alphabet, Inc (NASDAQ:GOOG) (NASDAQ:GOOGL), which gapped up over 10% higher after printing a fourth-quarter earnings beat after the closing bell on Tuesday.
Meta will print its earnings on Wednesday after the markets close. On CNBC, Kevin O’Leary said he’s a buyer ahead of the event and expects Meta's narrative to begin to shift this quarter toward a "curated metaverse."
Meta is expected to post an increase in revenues but a small decline in profit as it boosts spending on its Metaverse. Analysts estimate Meta will report revenues have risen to $32.6 billion for the fourth quarter, up 19.9% year-over-year and $10.9 billion profit, with would represent a 2% decline from the same period the year prior.
Analysts expect advertising revenues from Facebook and Instagram to account for about 98% of the total.
Meta’s chart is set to go either way because the stock is signaling both bearish and bullish indicators. Traders not already in a position may prefer to wait and see how the stock reaction on Thursday because earnings can create both volatile and irrational share price swings following the print.
See Also: Why Meta Platforms Looks Poised For A Rally On Earnings
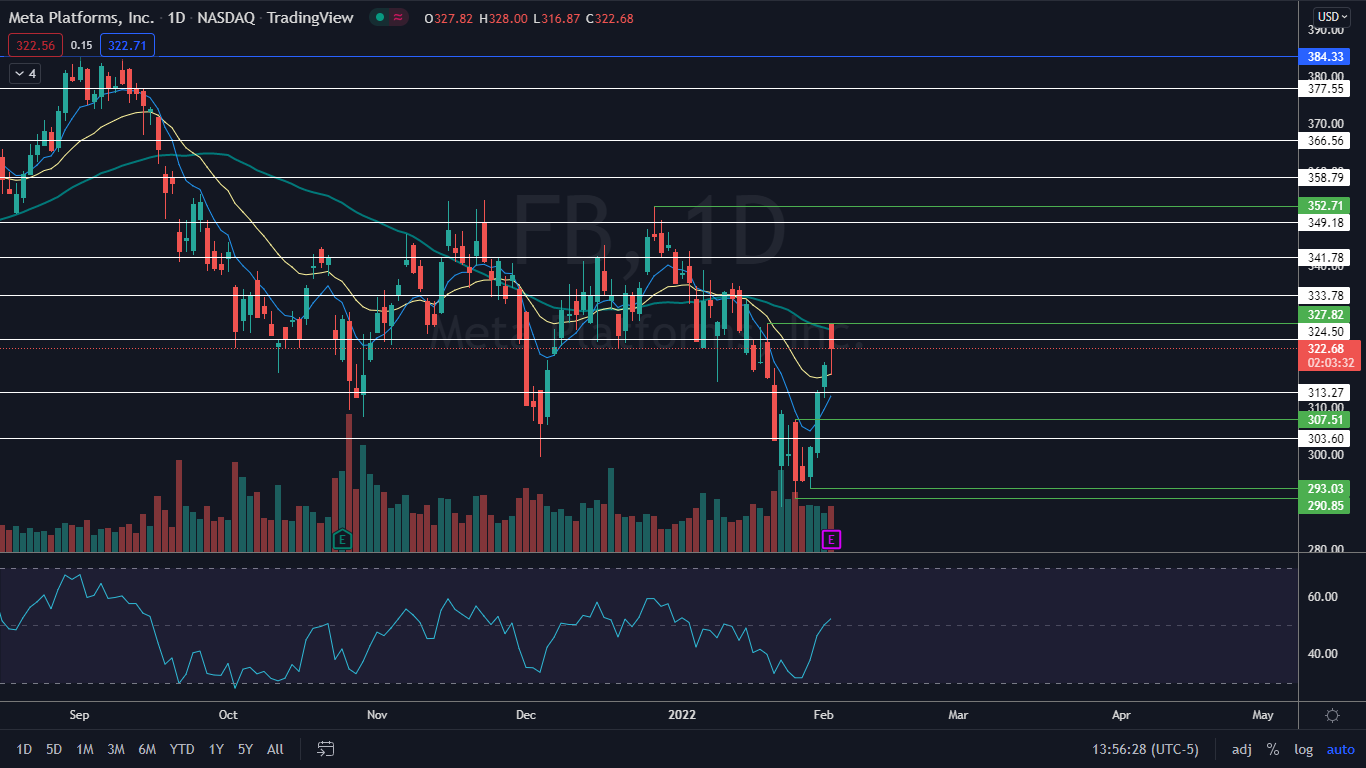
The Meta Chart: Meta is trading in a confirmed uptrend on the daily chart now that it has printed a higher low above the Jan. 26 low of $290.85 and a higher high above the Jan. 20 high of $327.82. The stock will eventually need to print another higher low to continue trading upwards within the pattern.
On the bear side, if Meta closes the trading day between about $324 and $328 it will print a bearish hanging man candlestick on the daily chart, which could indicate lower prices will come on Thursday. The candlestick is a lagging indicator, however, and won’t be able to be confirmed until further price action is seen.
On Tuesday, Meta regained the 21-day exponential moving average (EMA) after regaining the eight-day EMA on Monday, which is bullish. Bulls will want to see the stock continue to trade above the 21-day, which would eventually cause the eight-day to cross above the 21-day and would give bulls more confidence a longer-term run higher is in the cards.
Want direct analysis? Find me in the BZ Pro lounge! Click here for a free trial.
- Bulls want to see big bullish volume come in following the earnings print push Meta up above the 50-day simple moving average on the daily chart, which the stock was rejecting on Wednesday. There is resistance above at $324.50 and $333.78.
- Bears want to see big bearish volume come in and drop Meta down below the eight-day and 21-day EMAs and then for momentum to push the stock down 393.03, which would negate the uptrend. Meta has support below at $313.27 and $303.60.