Meta Platforms Inc (NASDAQ:FB) was trading more than 2% higher on Wednesday, breaking up from a triple inside bar on the daily chart.
On Thursday, the company’s stock ticker will change to META, over seven months after changing its name officially to Meta Platforms. The change was made to reflect Meta’s intended future direction, where it believes the metaverse will play the starring role.
Meta’s Crayta platform launched on Facebook gaming today. The product is a competitor to Roblox Corp.'s (NYSE:RBLX) gaming platform, offering a cloud-based game-creating platform that allows users to design their virtual worlds.
Traders and investors may have thought Meta’s launch of the competing platform would hurt Roblox but on the contrary, shares of Roblox were trading over 8% higher following the news. Like Meta, Roblox had also settled into a bullish triple inside bar pattern.
Want direct analysis? Find me in the BZ Pro lounge! Click here for a free trial.
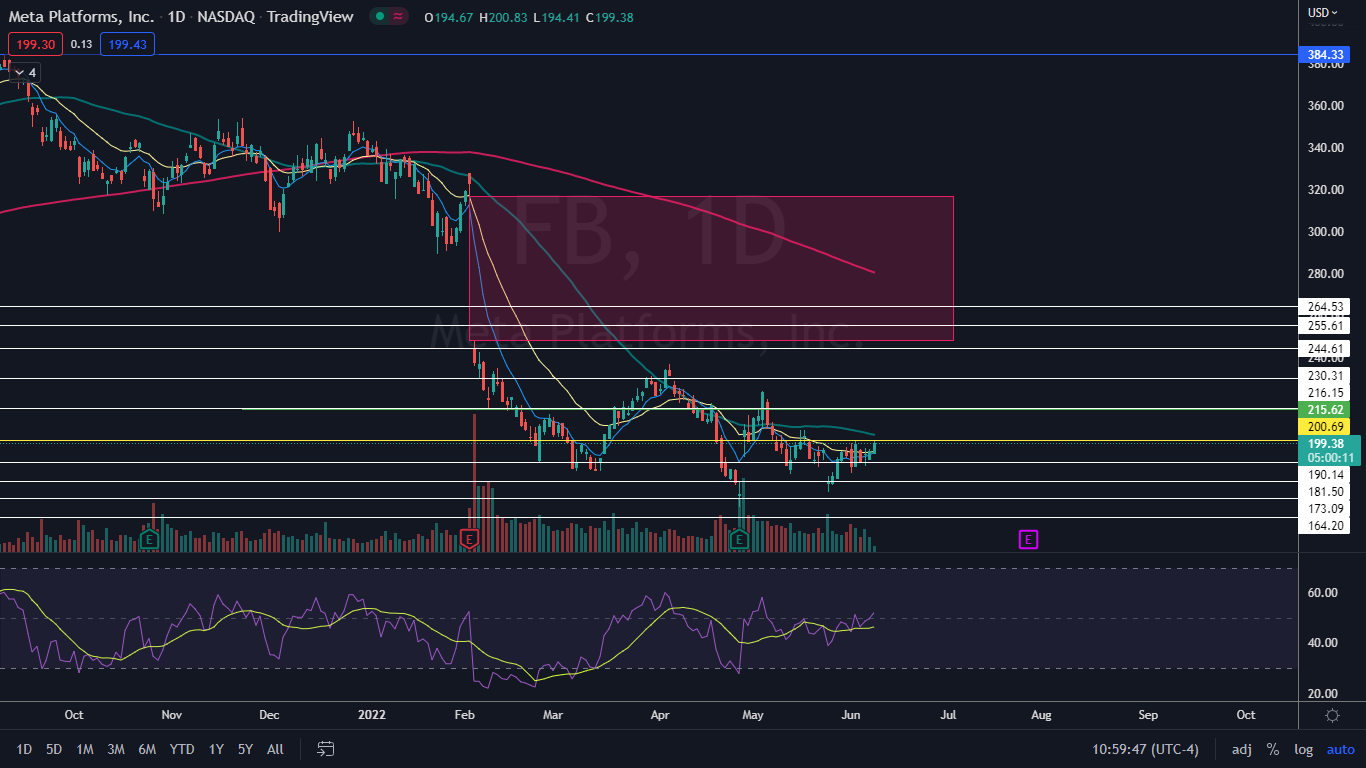
The Meta Chart: Meta formed the mother bar of the inside bar pattern on Friday and spent the following three trading days consolidating within Friday’s range. On Wednesday, the pattern was recognized and Meta broke up from the pattern on higher-than-average volume on lower timeframes.
- The pattern leaned bullish because Meta was trading higher before forming the inside bars but on the break upwards, the stock ran into heavy resistance at the $200 level. Bullish traders and investors will want to see Meta close the trading day above that key psychological level.
- If Facebook can close the session near its high-of-day price, it will print a bullish Marubozu candlestick, which could indicate higher prices will come again on Thursday and an uptrend may be in the cards. If the stock is unable to clear the $200 level, the sideways equilibrium may continue for longer.
- Meta has a large gap above on the chart that falls between the $248 to $316.87 range. Gaps on charts fill about 90% of the time, which suggests Meta is likely to rise to fill the gap at some point. If Meta can completely close the upper gap, it suggests a 58% move to the upside from the current share price.
- Meta has resistance above at $200.69 and $215.62 and support below at $190.14 and $181.50.

Photo: Meta Platforms


