The NHS has published its latest monthly performance figures for hospitals in England, which show the overall waiting list has fallen to its lowest level in more than two years, but long waits for treatment have increased and cancer targets continue to be missed.
Here, the PA news agency looks at the key statistics:
– Overall waiting list
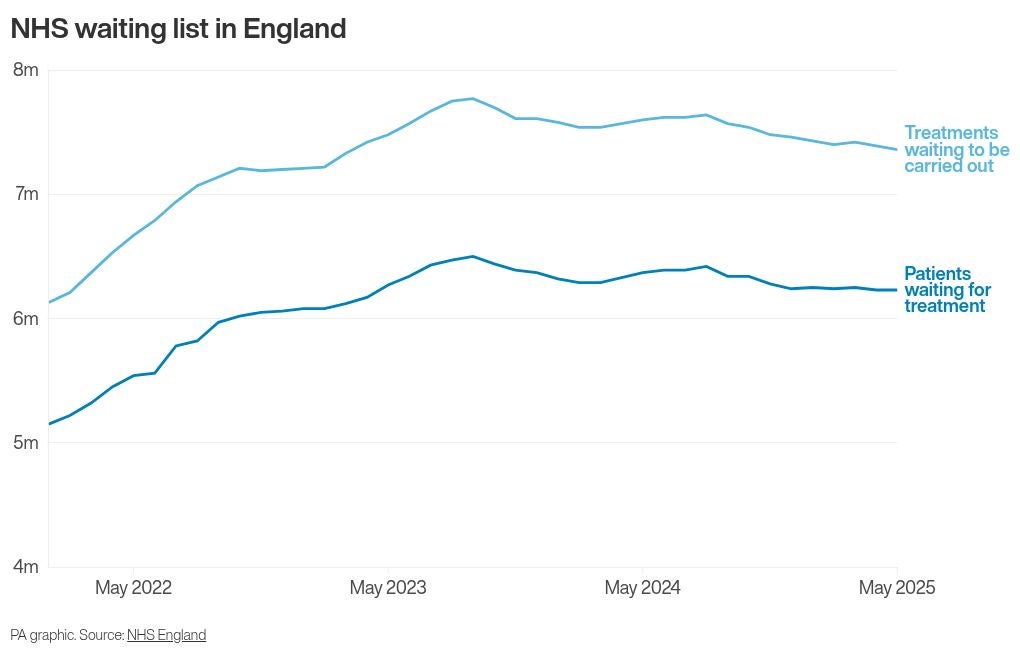
The waiting list for routine hospital treatment in England has fallen to its lowest level for more than two years.
An estimated 7.36 million treatments were waiting to be carried out at the end of May, relating to just under 6.23 million patients, down from 7.39 million treatments and just over 6.23 million patients at the end of April.
These are the lowest figures since March 2023 for treatments and April 2023 for patients.
The list hit a record high in September 2023, with 7.77 million treatments and 6.50 million patients.
The size of the list had been on an upward trend for much of the last 10 years, passing three million treatments in 2014, four million in 2017, five million in 2021 and seven million in 2022.
In February 2020, the last full month before the start of the Covid-19 pandemic, the list stood at 4.57 million treatments.
– Long waits for treatment
Some 1,237 patients in England had been waiting more than 18 months to start routine treatment at the end of May, down from 1,361 in April.
A year earlier, in May 2024, the number stood at 4,597.
There were 11,522 patients who had been waiting more than 65 weeks to start treatment, up from 9,258 the previous month.
This figure stood at 55,955 in May 2024.
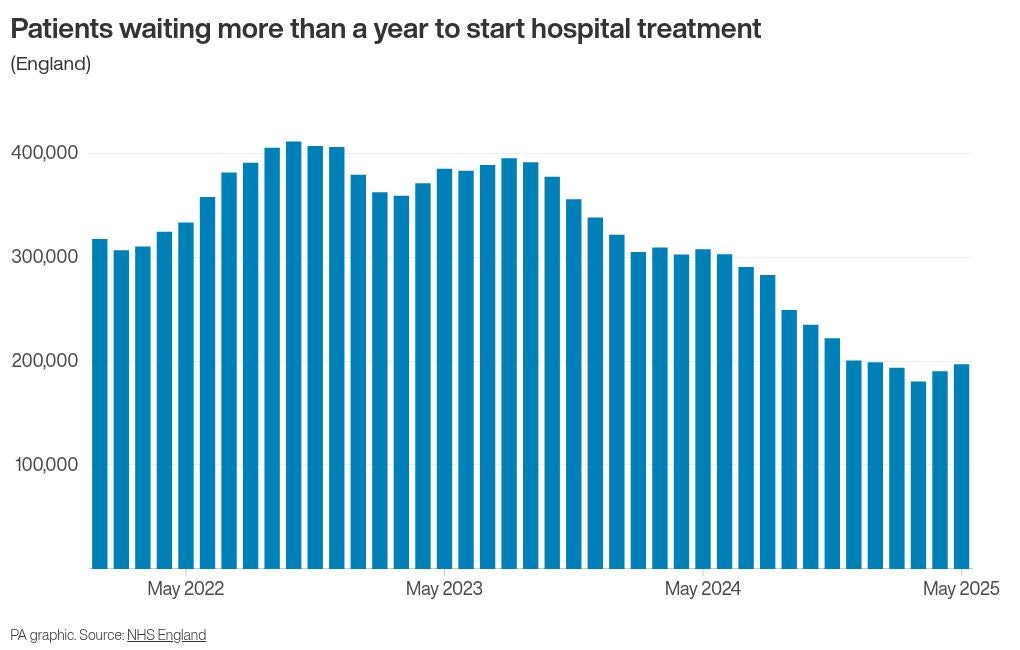
A total of 196,920 people in England had been waiting more than 52 weeks to start routine hospital treatment at the end of May, up from 190,068 at the end of April.
It is the second month in a row that this figure has increased, having previously fallen for 10 consecutive months.
Some 2.7% of people on the waiting list for hospital treatment had been waiting more than 52 weeks in May, up from 2.6% in April.
The Government and NHS England have set a target of March 2026 for this figure to be reduced to less than 1%.
– Accident & emergency waits
Some 75.5% of patients were seen within four hours in A&Es last month, up slightly from 75.4% in May.
The Government and NHS England have set a target of March 2026 for 78% of patients attending A&E to be admitted, discharged or transferred within four hours.
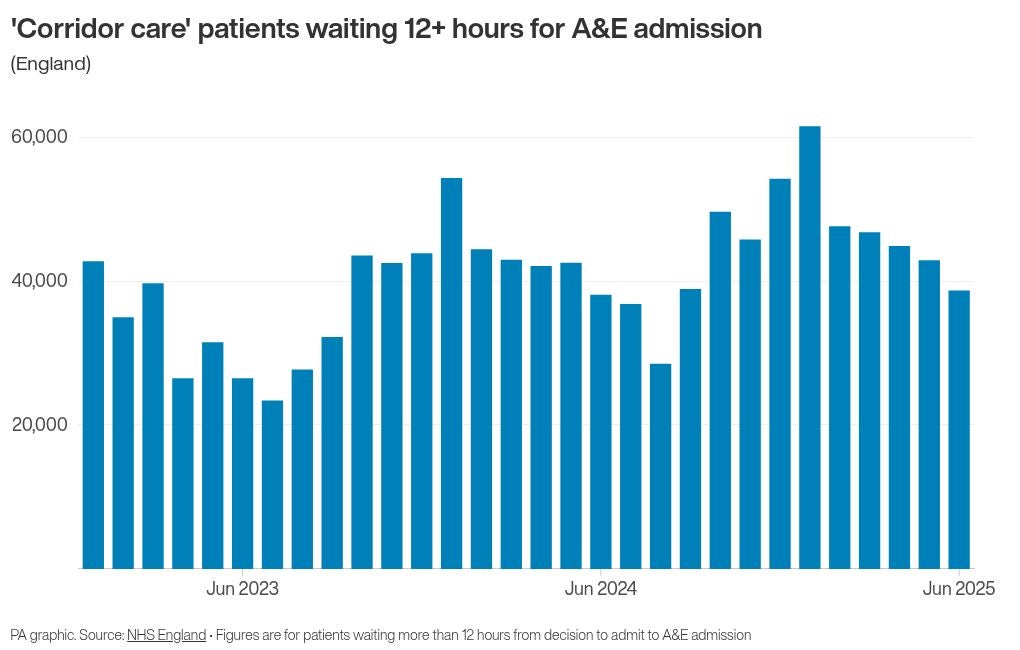
The number of people waiting more than 12 hours in A&E departments in England from a decision to admit to actually being admitted – so-called “corridor care” – stood at 38,683 in June, down from 42,891 in May.
The number waiting at least four hours from the decision to admit to admission also fell, standing at 118,171 in June, down from 130,035 in May.
– Cancer referrals
A total of 74.8% of patients in England urgently referred for suspected cancer were diagnosed or had cancer ruled out within 28 days in May, down from 76.7% in April and the third monthly fall in a row.
The Government and NHS England have set a target of March 2026 for this figure to reach 80%.
The proportion of patients who had waited no longer than 62 days in May from an urgent suspected cancer referral, or consultant upgrade, to their first definitive treatment for cancer was 67.8%, down from 69.9% in April.
The Government and NHS England have set a target of March 2026 for this figure to reach 75%.
GPs in England made 265,468 urgent cancer referrals in May, up from 264,880 in April but down year-on-year from 271,710 in May 2024.
– Ambulance response times
The average response time in June for ambulances dealing with the most urgent incidents, defined as calls from people with life-threatening illnesses or injuries, was seven minutes and 55 seconds.
This is up slightly from seven minutes and 50 seconds in May and is above the target standard response time of seven minutes.
Ambulances took an average of 29 minutes and 37 seconds last month to respond to emergency calls such as heart attacks, strokes and sepsis.
This is up from 27 minutes and 48 seconds in May.
The Government and NHS England have set a new target for this figure to average 30 minutes across 2025/26.
Response times for urgent calls, such as late stages of labour, non-severe burns and diabetes, averaged one hour, 44 minutes and 56 seconds in June, up from one hour, 34 minutes and 51 seconds in May.
– Diagnostic tests
More than 375,000 people had been waiting longer than six weeks for a key diagnostic test in May.
Some 376,669 patients, 22% of the total, were waiting longer than six weeks for one of 15 standard tests, including an MRI scan, non-obstetric ultrasound or gastroscopy.
This is up from 360,370 in April (21.2% of the total) and higher than the figure a year earlier in May 2024, which was 366,091 (22%).