Shares of FuelCell Energy Inc (NASDAQ:FCEL) are trading lower on Tuesday, pulling back slightly amid a 120% increase over the past month. Here's what investors need to know.
What To Know: The rally in FuelCell stock started after the company’s third-quarter earnings report earlier this month, which revealed a 97% year-over-year revenue increase alongside a corporate restructuring.
Investor enthusiasm in recent weeks is primarily linked to the growing energy requirements of the artificial intelligence industry and demand from data centers. As AI data centers demand more reliable power than traditional grids can supply, FuelCell's strategy to provide on-site solutions could gain market attention.
What Else: Wall Street analysts have taken notice, though ratings remain mixed. While firms like Canaccord Genuity and Keybanc recently reiterated Hold ratings, price targets are being revised upwards.
Last week, UBS maintained its Neutral rating, but raised its price target on FuelCell shares to $7.25 from $4.50, citing an improved outlook. This follows earlier warnings from some analysts that the stock appeared richly valued after its initial surge.
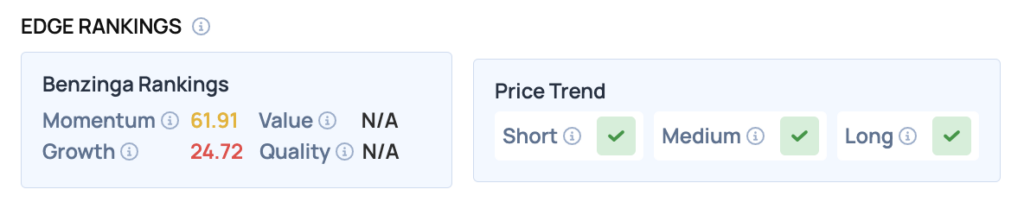
Benzinga Edge Rankings: Reflecting its recent rally, the stock has a Momentum score of 61.91, according to Benzinga Edge rankings.
FCEL Price Action: FuelCell Energy shares were down 5.94% at $9.03 at the time of publication Tuesday, according to Benzinga Pro. Over the past month, FCEL has gained about 130.3% versus a 3.5% rise in the S&P 500 and is up roughly 4% year-to-date compared to the index’s 13.1% gain. The stock is trading within its 52-week range of $3.57 to $13.98.
Technical Momentum: FuelCell Energy is currently trading at $9.67, showing a daily increase of 0.76%. The stock is significantly above its 50-day ($5.11) and 100-day ($5.17) moving averages, indicating strong bullish momentum. Key resistance is observed around the recent high of $10.17, while support may be found near the 200-day moving average at $6.27.
Read Also:
Image: Shutterstock