
While it might not be possible for everyone, an upper-class retirement should be the goal for your golden years. After a life of hard work and effort, there may be no greater reward than to spend your retirement years in luxury and comfort.
Explore More: GOBankingRates Original Research Center
View Next: 4 Housing Markets That Have Plummeted in Value Over the Past 5 Years
Before you can do that, however, it’s important to define what, exactly, is an upper-class income level. Per the Pew Research Center, an annual household income of $169,800 serves as a baseline for upper-class wealth. Additionally, as GOBankingRates has reported, an overall net worth of $714,000 to $2.1 million would place a retiree in the upper-class income bracket in America.
Once that level of wealth has been attained and retired upon, it’s time to find a comfortable — and safe — place to settle down. GOBankingRates recently analyzed data from the U.S. Census American Community Survey, Sperling’s BestPlaces, Bureau of Labor Statistics, AreaVibes, Zillow, Federal Reserve Economic Data and FBI Crime Data Explorer in order to find the wealthiest and safest cities in America to retire in.
Here are the top 10, based on that data.

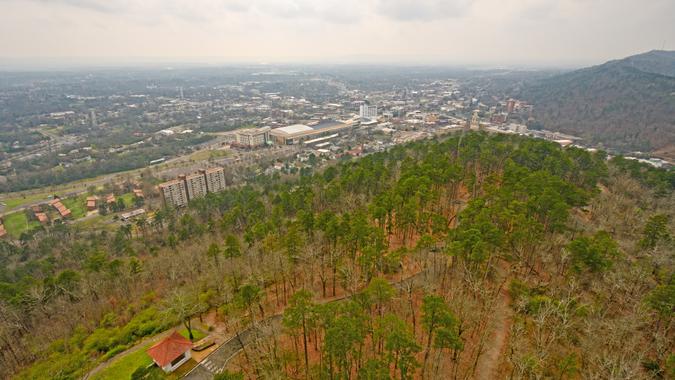
10. Bella Vista, Arkansas
- % of population 65+: 31.9%
- Average retirement income (before Social Security): $31,198
- % of households that pay under 30% for housing costs: 84.8%
- Property crime rate (per 1,000): 4.89
- Violent crime rate (per 1,000): 2.02
Read More: How Much a Comfortable Retirement Will Cost You in Each State
Learn More: How Much the Average Middle-Class Retiree Spends Monthly at Age 65

9. Sahuarita, Arizona
- % of population 65+: 21.2%
- Average retirement income (before Social Security): $43,801
- % of households that pay under 30% for housing costs: 81.7%
- Property crime rate (per 1,000): 9.77
- Violent crime rate (per 1,000): 0.92
Check Out: 5 Cities You Need To Consider If You’re Retiring in 2025
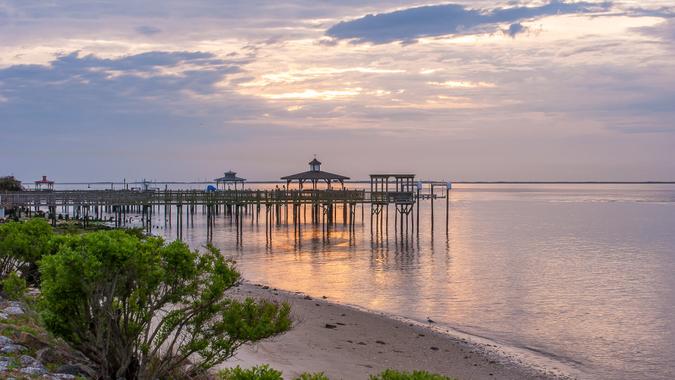
8. Leland, North Carolina
- % of population 65+: 27.6%
- Average retirement income (before Social Security): $43,945
- % of households that pay under 30% for housing costs: 78.5%
- Property crime rate (per 1,000): 9.83
- Violent crime rate (per 1,000): 0.96

7. Leawood, Kansas
- % of population 65+: 22.2%
- Average retirement income (before Social Security): $57,048
- % of households that pay under 30% for housing costs: 82.2%
- Property crime rate (per 1,000): 15.20
- Violent crime rate (per 1,000): 0.59

6. Mesquite, Nevada
- % of population 65+: 45%
- Average retirement income (before Social Security): $40,935
- % of households that pay under 30% for housing costs: 77.7%
- Property crime rate (per 1,000): 10.06
- Violent crime rate (per 1,000): 1.23
Find Out: How Long $1 Million in Retirement Will Last in Every State

5. Beavercreek, Ohio
- % of population 65+: 20.6%
- Average retirement income (before Social Security): $52,492
- % of households that pay under 30% for housing costs: 85.7%
- Property crime rate (per 1,000): 19.94
- Violent crime rate (per 1,000): 0.74

4. Rancho Palos Verdes, California
- Violent crime per 1,000 residents: 1.18
- Property crime rate per 1,000 residents: 8.48
- Ages 65+ average retirement income: $72,238
- Single-family average home value: $1,913,039
- Livability score: 58

3. Oro Valley, Arizona
- % of population 65+: 34.9%
- Average retirement income (before Social Security): $53,668
- % of households that pay under 30% for housing costs: 83.10%
- Property crime rate (per 1,000): 11.48
- Violent crime rate (per 1,000): 0.51
Consider This: How Far $750,000 in Retirement Savings Plus Social Security Goes in Every State
2. Hot Springs Village, Arkansas
- % of population 65+: 59.9%
- Average retirement income (before Social Security): $38,156
- % of households that pay under 30% for housing costs: 77.6%
- Property crime rate (per 1,000): 1.89
- Violent crime rate (per 1,000): 0.88

1. Pinehurst, North Carolina
- % of population 65+: 39.4%
- Average retirement income (before Social Security): $51,767
- % of households that pay under 30% for housing costs: 78.5%
- Property crime rate (per 1,000): 2.78
- Violent crime rate (per 1,000): 0.59
Editor’s note: Photos are for representational purposes only and might not reflect the exact locations listed.
Methodology: Using the U.S. Census 2023 5-Year American Community Survey, GOBankingRates identified retirement towns with populations of at least 5,000 with at least 20% of the population age 65 and over. Also sourced from the Census were total households, median household income, average retirement income, monthly owner costs as a percentage of household income above and below 30%. The cost-of-living indexes were sourced from Sperling’s BestPlaces, and national expenditure costs for all households were sourced from Bureau of Labor Statistics Consumer Expenditure Survey. The average home value was sourced from Zillow Home Value Index and the average mortgage was calculated using data from the Federal Reserve. Using the average mortgage and expenditure costs, the total cost of living for necessities was calculated. Using the crime data from the FBI, property crimes and violent crimes committed were used to calculate the violent and property crime rates per 1,000 residents. The percentage of households that spend under 30% of household income on selected monthly owner costs was scored and weighted at 1.00, the percentage of homes with retirement income was scored and weighted at 1.00, the average retirement income for households that receive it was scored and weighted at 1.00, the property crime rate was scored and weighted at 1.00, and the violent crime rate was scored and weighted at 1.00. All the scores were summed and sorted to show the safest and wealthiest retirement towns. All data was collected on and is up to date as of Oct. 2, 2025.
More From GOBankingRates
This article originally appeared on GOBankingRates.com: What It Takes To Be Upper Class in America Plus 10 Safest Retirement Towns for Upper Class