
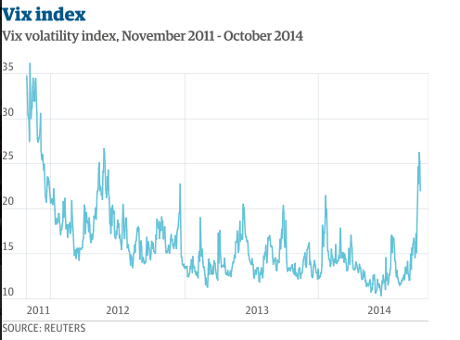
The Vix volatily index - known popularly as the fear index - hit a near three-year high last week, reflecting the toxic cocktail of bad news which has sent stock markets tumbling.
Investors are concerned about growing signs of a global economic slowdown, particularly in China and the eurozone, at the same time as major central banks such as the US Federal Reserve and the Bank of England are turning off the money taps which have supported stock markets for years.
On top of that, geopolitical risks continue to dominate the headlines, with air strikes in the Middle East, protests in Hong Kong, and the spread of the Ebola virus.
And judging by the volatility index, the uncertainty is not likely to end in the immediate future.
Last week the Vix index hit 30 during the day for the first time since December 201, reflecting investor panic, before falling back from this peak as a hint of better economic news improved the mood slightly. But at the current level of around 22, it is still at a two year high.
So what is the Vix?
The Vix is calculated by the Chicago Board Options Exchange, and measures market expectations of near-term volatility derived from prices paid for options on the US S&P 500 index.
After several research papers on the idea of a volatility index during the late 1980s and 1990s, the CBOE asked Vanderbilt University Professor Robert Whaley to develop a tradable index based on index option prices.
So in 1993, the Vix was born, and investors have been using the index to hedge against severe market movements ever since.
The index is not necessarily an indicator that investors believe the market will fall, but merely that it will move in one direction or another. The higher the index, the bigger the expected movement in the S&P.
And despite its recent rise, volatility is well below the levels seen at the time of the 2008 crash, when the index jumped as high at 80.
The Vix is “not at a crazy worry we’re going into a bear market by any stretch,” Randy Frederick of Charles Schwab told CNBC last week.
The index is calculated as the expected movement in the S&P 500 over the next 30 days, assuming a 68% likelihood or one standard deviation, which is then annualised. So if the Vix is at 30, that indicates the S&P is expected to move up or down by 30 divided by the square root of 12, or up to 8.6% over the next 30 days.