What Is the Unemployment Rate?
The unemployment rate, in simple terms, is the percentage of the workforce that is unemployed. It’s important to note here that the term “workforce” does not simply refer to everyone of legal working age in the U.S.—It includes only those who actively want to work. Individuals who aren’t working or seeking jobs (whether they are in school, living off savings or inheritance, or are unable to work) are not included.
Generally, the unemployment rate is considered a lagging indicator, meaning it changes in response to changes in other economic conditions rather than preceding them.
How Often Is Unemployment Data Measured? When Is It Released?
On the first Friday of each month, the unemployment rate for the previous month is released by the Bureau of Labor Statistics as part of its monthly Employment Situation Report. In the context of this report, individuals are considered unemployed if they were available and willing to work and actively sought work during the month in question.
How Is the Unemployment Rate Measured?
The unemployment rate is measured via the Census Bureau’s Current Population Survey (or CPS), which collects data from about 60,000 households by phone and in person. Individuals who are under 16, incarcerated, in the armed forces, or in care facilities are excluded from the sample, and the individuals sampled change over time.
There are several different versions of the unemployment rate, and each is calculated differently to provide different views of the country’s employment situation.
U-3 Unemployment Rate Formula
The U-3 unemployment rate is the most commonly cited, and when analysts discuss the unemployment rate, this is what they are referring to unless they specify otherwise. As mentioned above, this rate only considers individuals unemployed if they are willing and able to work and have actively sought employment over the past four weeks.
U-3 = Unemployed / Workforce
U-6 Unemployment Rate Formula
The second-most commonly cited unemployment rate is the U-6, or real unemployment rate, which includes both the marginally attached (those who were looking for employment but have stopped), and the underemployed (those who work part-time because they haven’t been able to secure full-time employment).
U-6 = (Unemployed + Marginally Attached + Underemployed) / Workforce
Other Versions of the Unemployment Rate
- U-1 = Unemployed 15 or More Weeks / Workforce
- U-2 = Terminated / Workforce
- U-4 = (Unemployed + Discouraged) / (Workforce + Discouraged)
- U-5 = (Unemployed + Marginally Attached) / (Workforce + Marginally Attached)
Marginally Attached vs. Discouraged Workers
Discouraged workers are similar to marginally attached workers in that they want to work and have sought work but haven’t done so in the past four weeks. The difference is that discouraged workers specifically believe that there are no jobs available to them because of age, qualifications, discrimination, or some other factor.
Marginally attached individuals may have stopped looking for work for other reasons. The marginally attached category is larger than and includes the discouraged category.
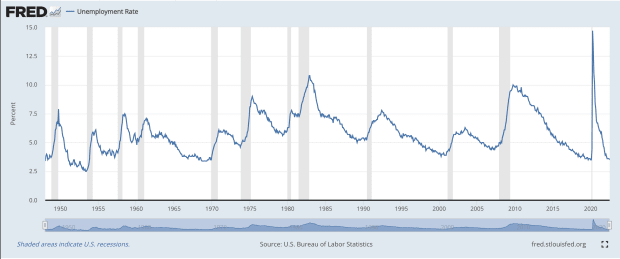
How Has the Unemployment Rate Changed Over Time?
Unemployment varies over time, but it tends to peak during periods of recession and fall during periods of economic health, stability, and GDP growth. The graph below depicts the U.S. unemployment rate (U-3 measure) from around 1948 to 2022. Shaded areas represent periods of recession.
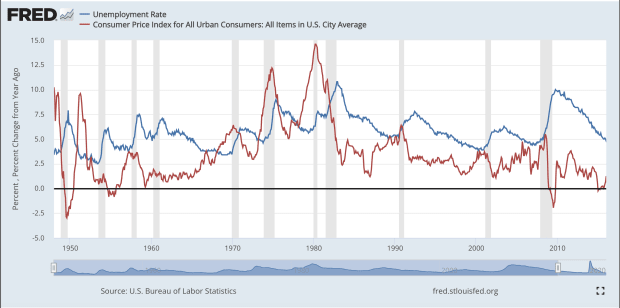
How Does Unemployment Relate to Inflation?
Generally, unemployment and inflation have an inverse relationship, meaning that when inflation is high, unemployment trends to be low, and vice versa. This relationship is sometimes called the Phillips Curve after economist A. W. Phillips, who made the claim that the inverse relationship between the two measures is stable and constant.
Phillips theorized that the lower the unemployment rate, the more people tend to spend. Increased spending, in turn, drives prices for consumer goods higher, increasing inflation.
While this relationship has been demonstrated time and time again, it certainly isn’t as constant or stable as Phillips suggested. For instance, the 1970s saw a long period of high unemployment and high inflation (a toxic combination known as stagflation) that turned this supposed relationship on its head, with both unemployment and inflation skyrocketing. In general, though, high inflation is typically accompanied by lower unemployment and vice versa.
The graph below overlays the inflation rate (red) with the unemployment rate (blue) and shows that, while generally the two have a somewhat inverse relationship (as suggested by the Phillips Curve), they occasionally move in tandem under certain circumstances.
How Does Unemployment Relate to the Stock Market?
The relationship between unemployment and the value of stocks is inverse and fairly stable. The lower the unemployment rate, the higher the stock market as measured by bellwether indexes like the S&P 500.
This makes sense—when people are working, they have more spending money, which means demand for consumer goods and services is high. High demand can translate to good earnings, which can drive stock prices up.
As with any relationship, however, there are exceptions to this trend, but generally, periods of low unemployment see stocks move higher as a whole.
How Does Unemployment Relate to Economic Recession?
Recessions represent a decline in economic activity, usually measured in terms of the GDP. That being said, many define recessions as being characterized by higher-than usual-unemployment in addition to negative GDP growth.
In other words, the two are linked—periods of recession are typically accompanied by a rise in unemployment. This relationship can be seen clearly in the graphs above, where recessions are marked by shaded areas.