What Is the Purchasing Managers’ Index?
The purchasing managers’ index is a major monthly economic indicator that focuses on the performance of the manufacturing sector. It is used to determine periods of expansion and contraction in the U.S. economy. Variations of the purchasing managers’ index include reporting on services, by nation, and who compiles it.
The most widely followed PMI on the U.S. economy is the ISM Manufacturing Index, which is compiled by the Institute for Supply Management.
Unlike other economic indicators that provide actual data on orders, output, and such, the PMI is based on a survey of sentiment from hundreds of purchasing and supply executives in the private sector across the country. The index tracks views on production, new orders, backlogs of orders, employment, inventories, supplier deliveries, exports, imports, and prices for raw materials.
Why Is the Purchasing Managers’ Index Important?
The PMI is typically used as a leading indicator of the U.S. economy because it covers a wide range of views on the current state of manufacturing, and the data can be used with other key indicators (such as gross domestic product, industrial production, employment, and inflation) to predict the performance of the economy. For example, investors and economists have three months of PMI data to analyze before GDP results are released each quarter.
The overall PMI number provides anecdotal evidence on the performance of the economy and whether companies are ordering more commodities ahead of time as inflation picks up or shipping out more products to meet consumer demand. Subindexes also show if employment is contracting, if supplier deliveries are moving at a faster rate, or if customers’ inventories are too high.
The PMI is also among the first sets of economic indicators to be released each month, giving early clues on the state of the economy.
Who Compiles the Purchasing Managers’ Index?
The Institute for Supply Management conducts surveys on hundreds of manufacturing supply executives in the U.S. It has been compiling PMI since 1931, and from which the index got its name. ISM was known as the National Association of Purchasing Management until 2002.
The data are compiled during the middle of each month and are compared to data from the middle of the prior month. Some respondents to the survey also leave comments about the state of manufacturing, which ISM also publishes at the same time its report is released.
The ISM calculates nine different subindexes. These include new orders, production, employment, supplier deliveries, inventories, prices, new export orders, imports and backlog of orders. The production index is used to help predict industrial production. The prices index is used to help predict the producer price index. The new orders index is used to help predict factory orders. The employment index is used to help predict manufacturing employment. And the supplier deliveries index is a component of the leading economic indicators index.
When Is the Purchasing Managers’ Index Released?
The PMI is released on the first business day of the month at 10 a.m. ET. The ISM Report on Business includes surveys on manufacturing and non-manufacturing.
Upcoming Release Dates in 2022
How Is the Purchasing Managers’ Index Calculated?
The typical question asks whether conditions remain the same, have improved, or have deteriorated. The results are then calculated as a diffusion index, which is a measure of the dispersion of change, and the data over periods of time are collected and graphed to show peaks and troughs.
In the PMI survey, respondents are asked whether a particular condition has changed, and that is recorded as a value. For example, if a condition remains the same, a value of 50 is assigned. The extremity for improvement is 100, while the extremity for deterioration is zero.
A PMI greater than 50 suggests expansion in manufacturing, while a reading of less than 50 indicates contraction. Those levels are often interpreted correspondingly as to whether the overall economy is growing or shrinking. Organizations that conduct PMI surveys have their own method of calculation, but the basic formula is below.
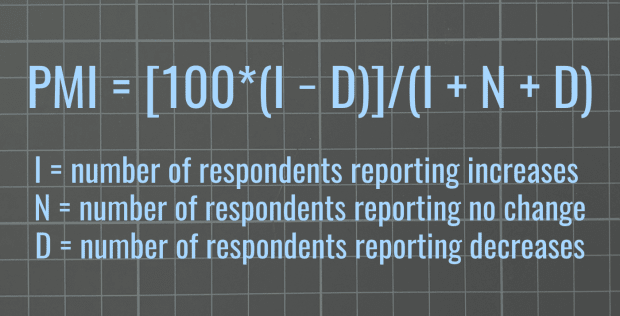
Generally, a PMI above 50 would be good for financial markets, and one below 50 would be bad. Investors and analysts, though, tend to compare the PMI of the reporting month to that of the previous month. The stock and bond markets tend to react favorably to increases in PMI and negatively to decreases. Month-on-month changes are used as an indication of whether the economy was expanding or contracting.
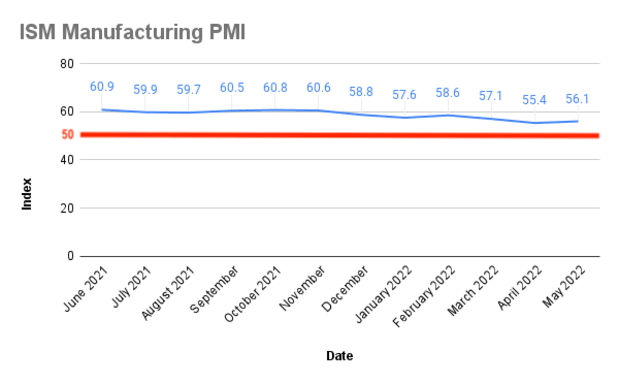
Below is a graph of PMI data.
What Is the Flash Purchasing Managers’ Index?
Some organizations release early estimates of final numbers for the reporting month, which are known as flash numbers, and those are typically released one week before the end of the reporting month. Standard & Poor’s, for example, releases its S&P Global Flash US Composite PMI. IHS Markit has its Flash PMI, which is based on 85 percent to 90 percent of all PMI responses.