What Is the Case-Shiller Home Price Index?
The Case-Shiller Home Price Index, officially known as the S&P CoreLogic Case-Shiller U.S. National Home Price Index, is a key monthly measure of the changes in value of existing single-family homes in the U.S. Its subindexes track home values in major metropolitan housing markets across the country.
Unlike other indexes that focus on new-home sales, the Case-Shiller index targets existing home sales because homes often change hands, and their value can be evaluated over a long period through recorded transactions that can span decades.
The U.S. Census Bureau, for example, compiles sales of new homes across the nation, but only the first sale of each home after its construction is recorded. The Case-Shiller index, on the other hand, tracks repeat sales of the same single-family detached home for appreciation or depreciation in value. With that in mind, there are more existing homes to track each month than there are new homes.
There are three composite indexes that track the change in value of residential homes. The main one is the S&P CoreLogic Case-Shiller U.S. National Home Price NSA Index (NSA is an abbreviation for non-seasonally adjusted), which has been tracking home prices in the nine geographical divisions set by the Census Bureau since 1987. The S&P CoreLogic Case-Shiller 10-City Composite Home Price NSA Index tracks 10 major metropolitan areas, while the S&P CoreLogic Case-Shiller 20-City Composite Home Price NSA Index covers a broader group of places.
Who Started the Case-Shiller Index?
Two economics professors, Karl Case and Robert Shiller, were separately studying housing prices in Boston and economic bubbles in the 1980s, and together they developed a way to track repeat home sales—this methodology became the Case-Shiller Index. A company was formed, and Standard & Poor’s eventually took over the Case-Shiller Index.
Why Is the Case-Shiller Index an Important Economic Indicator?
The real estate market experiences boom and bust cycles, and the Case-Shiller Index’s tracking of home prices helps investors and analysts determine whether the housing market is in a bubble. Sustained gains over a period could lead to a precipitous decline, and those movements could help to indicate whether the economy is contracting. Increases over a period could also indicate inflationary pressures. Prices of homes rising rapidly over a short period might suggest that prices for other goods, such as food and gasoline, and even wages, could be accelerating. A sudden pick-up in inflation might push the Federal Reserve to tighten monetary policy.
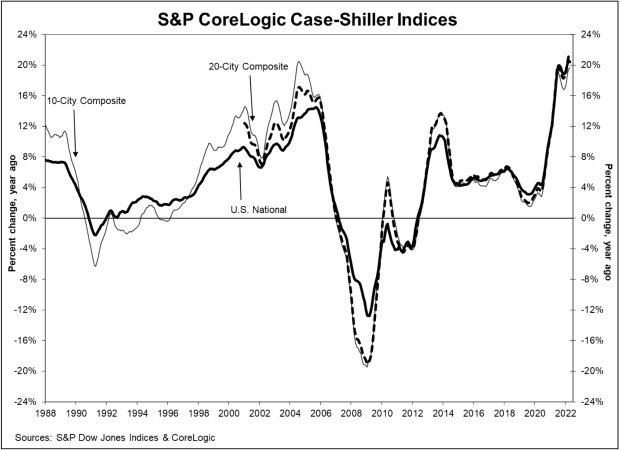
Below is a graph of the Case-Shiller indexes. Periods of sustained gains are typically followed by declines. Two such declines preceded the U.S. economy slipping in recession in 2001 and 2008.
When Is the Case-Shiller Index Released?
The Case-Shiller index is released by Standard & Poor’s on the last Tuesday of each month at 8 a.m. ET.
Upcoming Release Dates in 2022
How Is the Case-Shiller Index Calculated?
The Case-Shiller index calculates prices by month, on a year-on-year basis, on housing markets across the country. S&P also calculates on a month-on-month basis.
There are five key methodologies used in the construction of the indexes:
- Repeat Sales Method: Focusing on the sale of a house at different periods
- Index Approach: Measuring the increases or decreases in the market value of homes in 20 metropolitan areas
- Creation of Sales Pairs: Matching the latest price to the previous one and measuring the difference
- Weighting of Sales Pairs: Assigning weights to sales pairs to account for fluctuations in price
- Three-Month Rolling Average: Accumulating sales pairs in three-month rolling periods to help smooth out price data
How Do Financial Markets React to the Case-Shiller Index?
Steady increases in the index could indicate that the economy continues to grow, and investors would react positively to stock and bond prices. Conversely, declines could be interpreted negatively by investors.
Prospective homebuyers could use the data as an indication of when to buy. Small, incremental gains in the index after a period of decline or a plateau could indicate a good time to make a purchase. A quicker pace of gains, though, might mean that valuations for homes might be rising too quickly and could precipitate a frothy environment.
What Are the Limitations of the Case-Shiller Indexes?
The index doesn’t factor in external factors such as quality of life in a neighborhood. There may also be fewer, or slowing, sales transactions in a downturn. There is also a two-month time lag from the reporting month to the release, so the index is not quite as timely as some of the other indicators on homes.