Canva
What Is Standard Deviation?
Standard deviation is a metric that measures the variability of a security’s returns over time. It can be used to gauge volatility based on past performance and compare a future return to past returns. Standard deviation can also quantify the distribution of returns of individual portfolios, and can be used on different types of assets, including bonds, commodities, and cryptocurrency. This article, though, focuses on stocks.
Standard deviation shows how far a stock’s return is from the average return, and can also determine whether a return for a certain period is an outlier. It’s useful to apply during times of volatility in the share price, as large up and down swings during a short period can help to determine investment risk versus reward.
How to Calculate Standard Deviation Using a Spreadsheet
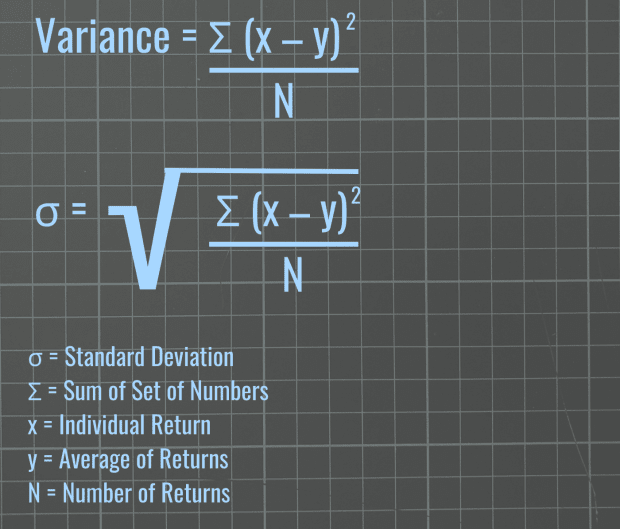
Understanding standard deviation means first understanding variance because standard deviation, mathematically speaking, is the square root of variance. Variance shows how far each return is from the average, or mean, of the set of return data.
A number greater than 0 indicates that the returns in a set are distant from the average and far from each other, while a number significantly greater than 0 suggests being much farther from the average. Because the variance of the data is squared, standard deviation brings the data back to the same unit of measure (in the case of stocks, percentage) by taking the square root.
Note: Standard deviation is represented in formulas by σ, the Greek lowercase letter for sigma.
The most efficient way to calculate standard deviation, especially with a large set of data such as daily stock prices, is via spreadsheet. Below is an example of calculating the standard deviation of Apple’s stock returns over a three-month period.
Step 1: Collect daily data going back over a three-month period. This roughly equates to about 20 days per month, and the first day serves as the base price in calculating the first percentage change. Calculate daily percent change for Apple’s stock, and express the data in percentage terms. Note: The formula is shown in the cell as well as in the field area on the top left corner of the spreadsheet. Apple's closing stock price (expressed in U.S. dollars) accounts for adjustments, including splits, dividends, and/or capital gain distributions.
Step 2: Calculate the average of the returns using the AVERAGE function.
Step 3: Calculate the variance of the returns using the VAR function.
Step 4: Calculate standard deviation of the returns using the STDEV function. Note: The average and standard deviation are expressed as percentages, while the variance is a decimal number.
How to Interpret Standard Deviation
In the example above for Apple, the data show that the average return for the three-month period was 0.08 percent. The variance shows the distance of the range of numbers from the average. But the standard deviation shows exactly how far returns are from the average. With standard deviation at 1.91 percent, it suggests that the range is plus or minus 1.91 percentage points from the average, meaning that Apple’s returns tend to range from -1.83 percent to 1.99 percent.
Standard Deviation as Probability in Normal Distribution
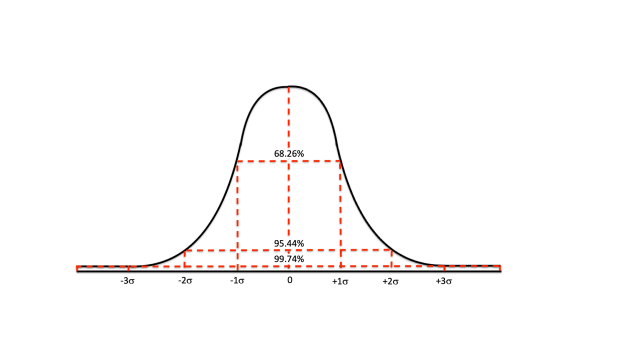
Standard deviation can best be illustrated via the normal distribution pattern for probability, which gives a statistical view of where standard deviation might be. In the normal distribution, most of the scenarios in probability tend to occur closer to the mean. Rarer instances tend to occur outward, toward the areas that flatten known as tails.
In the graph below, a normal distribution is shaped like a bell, hence its nickname the bell curve, with the middle of the curve representing the mean. The figures listed horizontally below the graph are known as z-scores, which range from -3 to 3. They are standard deviation points and are articulated differently than the standard deviation formula, which is expressed as a percentage.
The normal distribution calculation can provide probabilities on which parameters potential returns might be. Let’s say a day trader projects Apple’s stock gaining 5 percent the day after reporting record earnings and revenue for the latest reported quarter. What’s the probability the stock will post a 5 percent return the next day?
The z-code formula can show where the return would be on the normal distribution graph.
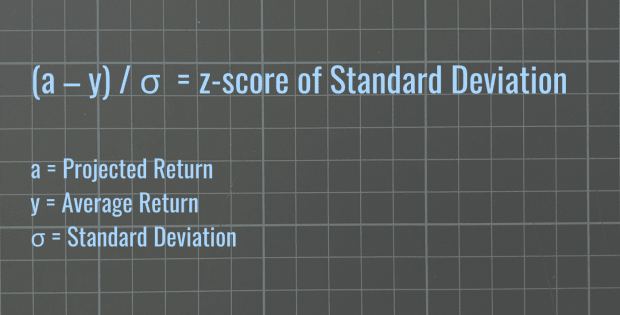
By plugging in Apple’s projected return, average, and standard deviation taken from the above spreadsheet:
(5% - 0.08%) / 1.91% = 2.57 Standard Deviations Above the Average.
A potential 5 percent return on Apple’s stock would be 2.57 standard deviations above the average, falling between 2 and 3 standard deviations from the mean. Statistically speaking, it indicates a 2.28 percent probability of achieving the projected 5 percent return. That 2.28 percent probability is derived by subtracting 95.44 percent from 100 percent, and the difference (4.56 percent) is then divided by two because of the equal amounts of probability on each side (negative and positive) of the symmetrical line in the normal distribution graph. In any case, a 5 percent daily gain on Apple’s shares wouldn’t be common.
Another way to interpret the normal distribution is to say that the probability of Apple’s return (at a range of -1.83 percent and 1.99 percent) falling within -1 and 1 standard deviation from the mean is 68.26 percent. The probability of a standard deviation between -2 and 2 is 95.44 percent, and between -3 and 3, it is 99.74 percent.
How Does Standard Deviation Relate to Volatility?
Standard deviation can show how a return relates to the average. A high standard deviation would indicate high volatility, and a return that is greater than the standard deviation range suggests that it is an outlier. A series of up and down swings outside that range for a period would also indicate high volatility.
Frequently Asked Questions (FAQ)
The following are answers to some of the most common questions investors ask about standard deviation.
Can Standard Deviation Be Negative?
Standard deviation cannot be negative because it takes the square root of the variance.
What Is a Good Standard Deviation?
A good standard deviation is subjective to the standards of the investor or analyst. Comparing a stock’s standard deviation to a benchmark index’s could provide some analysis as to what falls within “normal” parameters. Some investors purposefully seek out securities with high volatility, while others do the opposite.
How Should Standard Deviation Be Phrased in Investorspeak Terms?
One way to phrase standard deviation is to say that a stock's return has a standard deviation of X percent, which means adding and subtracting that percentage from the mean can provide a statistically meaningful range of likely returns. When referring to normal distribution and probabilities, one could say that a stock’s return can fall within 1, 2, or 3 standard deviations from the mean.