Canva
What Is Beta?
Beta is a metric used in technical analysis to measure the volatility of a security or portfolio against a market benchmark. In the case of a company’s share price, it measures the volatility of a stock against a benchmark index using historical data. Systematic risk is a characteristic of a stock’s beta and refers to risk that is related to the stock market.
For example, a stock’s risk is measured against a benchmark stock index, such as the S&P 500 Index in U.S. trading. It’s useful in determining a stock’s volatility relative to the benchmark, especially during bull and bear markets. For investors, looking at a stock’s beta can be key: generally, the higher the beta in a rising market, the higher the return. Conversely, in a bear market or correction, a higher beta could point to larger potential loss.
Beta, represented by the Greek lowercase letter β, is also used in the formula for the weighted average cost of capital, which calculates a company’s cost of capital. This article, though, focuses on a stock’s beta.
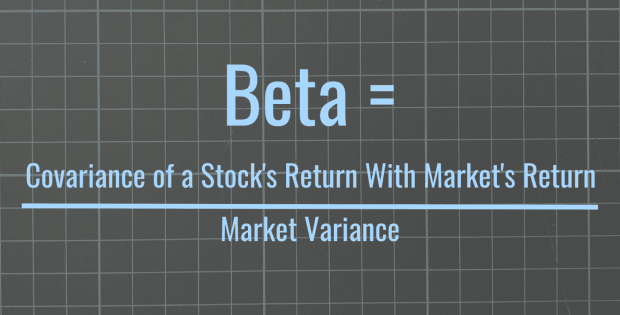
Beta Formula
Beta = Covariance of a Stock’s Return With Market’s Return / Market Variance
How to Calculate Beta
Probably the best way to calculate beta is via a spreadsheet because of the vast amount of necessary data. Collecting historical price data for a stock and its benchmark index typically requires accessing a database online. Below is an example of calculating beta of Apple using historical data of its stock price and the S&P 500 Index.
Step 1: Collect monthly data going back five years. Apple’s closing stock price accounts for adjustments, including splits, dividends, and/or capital gain distributions. Calculate percent change for each. Note: The formula is shown in the cell and in the field area on the top left corner of the spreadsheet.
Step 2: Calculate covariance between Apple and the S&P 500. Covariance measures the stock’s relationship to the benchmark index (namely via percentage changes), while variance measures the spread of the benchmark’s percentage change in price.
Step 3: Calculate variance of the S&P 500.
Step 4: Calculate beta.
How to Interpret Beta
Some investors and analysts use 5-year betas, and data for beta are collected on a monthly basis for 60 months. Others use fewer years based on monthly data, and weekly data for 1-year beta.
A beta close to 1 indicates that a stock’s volatility is average, and its moves are largely in line with the market’s. A beta greater than 1 shows that the stock’s volatility is above average. In a bull market, the stock rises faster than the market, but in a bear market, it falls faster. With a beta less than 1, the stock’s volatility is below average. In a bull market, its gains are slower than the market, while in a bear market, its declines are slower. A beta of zero means no volatility and no risk.
The 5-year data from early 2017 to early 2022 in the Apple-S&P 500 Index example above showed that with Apple’s beta at 1.1727, the stock has above average volatility. As the market—using S&P 500 as the benchmark—gained in the 5-year period, so did Apple. Since both Apple and the S&P 500 rose during the 5-year period, they would be categorized as being in a bull market, and based on Apple’s beta, the table below indicates that Apple’s stock moved faster than the market. The “higher the beta, the higher the return” mantra can be shown by Apple’s more than 5-fold gain versus the 90 percent gain for the S&P 500 over the 5-year period.
Another interpretation would be that, based on a beta of 1.1727, Apple’s stock was 17.27 percent more volatile than the S&P 500 during the 5-year period. Conversely, if Apple had a beta of 0.7, it would suggest Apple was 30 percent less volatile than the benchmark. Another interpretation would be to say that Apple’s stock gained 1.17 times more than the market’s return.
Beta Value Meaning at a Glance
How Is Beta Used?
While beta is technical and historical in nature with its focus on past prices,some investors use it as part of a trading strategy betting on the future direction of a stock. Beta can be used as part of an investment strategy using fundamental analysis, which involves reviewing a company’s financial statement.
Beta can also be used in conjunction with other technical measures of stock price performance such as correlation and standard deviation. Correlation compares a stock’s price movement to a benchmark index such as the S&P 500 or another stock. A correlation of 1 means that the stock and benchmark move in lock step with each other in the same direction while a correlation of -1 indicates they move in the opposite direction. While beta is a measure of systematic risk, standard deviation is a measure of total risk.
Where to Invest in Beta Stocks
Asset management firms have exchange-traded funds (ETFs) that focus on stocks’ betas. The AGFiQ U.S. Market Neutral Anti-Beta ETF from AGF Management is a strategy fund that takes a 50 percent long position in low-beta U.S. stocks and a 50 percent short position in high-beta stocks. One of AGF's premises for the fund is to generate positive returns regardless of the market’s direction, as long as low-beta stocks outperform high-beta stocks.
Investors and analysts also monitor the S&P 500 High Beta Index, which measures the performance of 100 stocks in the S&P 500 Index most sensitive to beta, as well as beta indices that focus on companies with smaller market capitalization.
Frequently Asked Questions (FAQ)
The following are answers to some of the most common questions investors ask about beta.
Can Beta Be Negative?
Beta can be negative and would indicate that a stock moves in the opposite direction of the market. A stock with negative beta would advance as the market falls and decline when the market rises.
How Does Alpha Compare to Beta?
While beta measures the volatility of a security or portfolio relative to a benchmark, alpha measures the return.