Exela Technologies, Inc (NASDAQ:XELA), a small cap business process automation company, was nosediving over 15% lower at one point on Wednesday after plunging over 32% on Tuesday.
On Tuesday, Exela began trading on a 1-20 split adjusted basis, which caused a negative reaction for the company’s common stock. Shares of Exela had also run up into the event, and when a stock runs prior to known news, a sharp decline often follows.
Exela announced recently a partnership with the Dian Fossey Gorilla Fund. The charity, which protects mountain gorillas, and Exela are selling cobranded #ApeNation gear such as T-shirts and hats to raise money for the endangered animal and its conservation.
The news received attention on Reddit, where at least one user posted an analysis on Exela. The company could now find its place among the group of meme stocks that retail traders take heavy interest in due to its fairly high level of short interest.
Exela has 2.56 million, meaning 11.63%, of its 22-million-share float held short. The number is up from 2.48 million shares in July.
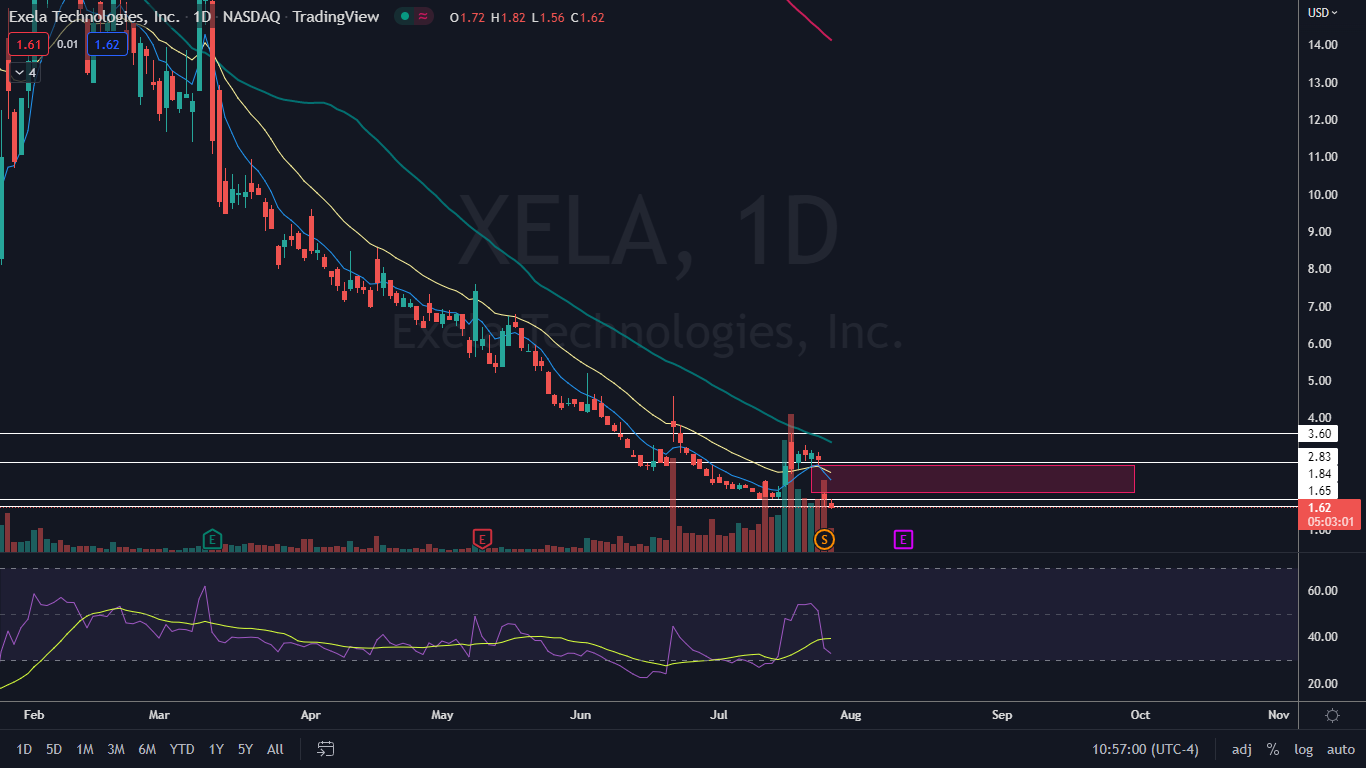
From a technical standpoint, Exela needs bulls to step in quickly, because on Wednesday the stock was printing another new all-time low and there is no support in the form of price history below.
Want direct analysis? Find me in the BZ Pro lounge! Click here for a free trial.
The Exela Chart: On Tuesday, Exela confirmed it was trading in a downtrend by printing a lower low under the previous low of $2.62, which was formed on July 20. The first indication that a downtrend may be on the horizon occurred on July 21, when Exela formed a lower high at the $3.28 mark.
- On Tuesday, Exela printed a hammer candlestick on the daily chart, which could have indicated the stock would trade higher on Wednesday, but the bears look to be in full control of Exela for the time being.
- Eventually the stock will bounce up higher, at least to print another lower high, and traders can watch for another reversal candlestick to print on high bullish volume.
- The bounce is likely to come over the next few days because Exela’s relative strength index (RSI) is measuring in at about 33%. When a stock’s RSI reaches or fall under the 30% level it becomes oversold, which can be a buy signal for technical traders.
- Bullish traders may choose to wait for the stock's bearish volume to continue decreasing on the daily chart, which may eventually indicate a reversal is on the horizon.
- Exela has resistance above at $1.65 and $1.84. There is psychological support below at $1.50.