Wells Fargo (WFC) shares are trading well on Monday even though the stock is down around 0.5%.
That's because after gaining 5% in last week’s trade, the shares started the week off as much as 2.25% in early trading.
As noted earlier by TheStreet, WFC shares were trading lower after a report “suggested the bank is preparing to significantly reduce its once-leading mortgage business.”
Despite the news, the bulls are busy buying the dip, which is no surprise given the recent action in the banks.
Wells Fargo stock is up more than 17% over the past four weeks. It's not the most impressive recent performer among the major banks. But it’s the best performer of the group over the past 12 months and year to date.
Trading Wells Fargo
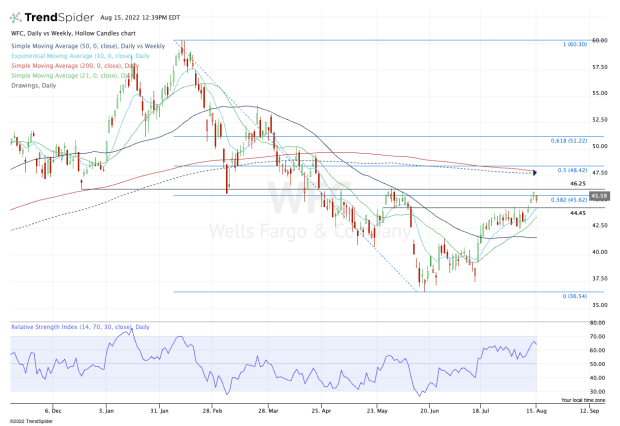
Chart courtesy of TrendSpider.com
Last week, Wells Fargo stock made a bullish move, clearing $44.50. This was a support level in May and a major resistance level in July and August after the stock moved significantly higher on the earnings report.
The bank's shares have been surging lately, rallying 2.1% on Wednesday and Thursday and another 1.5% on Friday. And the surge put the stock running headlong into the 38.2% retracement.
If Wells Fargo can push through the $46.25 zone — which was support in the first quarter and resistance in the second quarter — the door to higher prices opens.
Specifically, the 50% retracement comes into play near $48.50, with the 200-day and 50-week moving averages come into play just below that. Above that zone and $51.50 is on the table.
On the downside, the bulls would love to see the 10-day moving average come into play as support near $44 to $44.50, enabling prior resistance to buoy the stock.
It becomes a bit more concerning if these levels fail as support.
Below $42.50 and the 50-day moving average is in play. This measure had been resistance until it was reclaimed in July, but it will need to be support if Wells Fargo pulls back and the bulls want to stay in control.
Trading the Bank Stocks Broadly
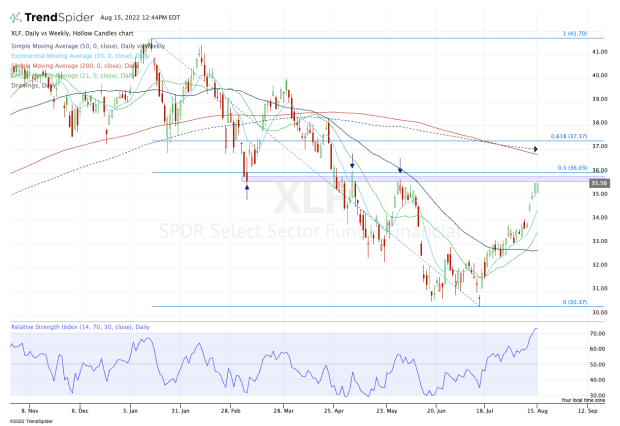
Chart courtesy of TrendSpider.com
Zooming out a bit to the Financial Select Sector SPDR Fund (XLF), we’re seeing a similar buy-the-dip reaction today.
It’s pretty simple, though. On the upside, the bulls want to see XLF take out the $35.50 to $36 area. Until proved otherwise, this zone is resistance, as it was support in the first quarter and resistance in the second quarter. Plus it’s where the 50% retracement comes into play.
In that sense, the setup is much like Wells Fargo.
On the downside, the bulls want to see active support, via the 10-day moving average, buoy the XLF and for $34 to act as support. Below that puts $32.50 to $33 in play and the 50-day moving average.