Energy stocks are on the move on Monday morning. That’s as the S&P 500 pushes higher, as oil prices jump and as Warren Buffett remains a bull in Occidental Petroleum (OXY).
A Schedule 13-G updated investors on Friday after the close that Buffett’s Berkshire Hathaway (BRK.A) (BRK.B) had confirmed its recent stake in Occidental Petroleum, which now stands at 26.8% when including the warrants.
Occidental shares are up about 2.5% on the day, as investors feel a bit more emboldened by Buffett's position with the stock.
For what it's worth, Buffett has regulatory approval to buy up to 50% of the firm.
Shares of Occidental Petroleum have traded quite well so far this year, up more than 130% even though shares are down about 13% from the highs. That said, it hammered out a nice support level last week, so let’s take an updated look at the charts.
Trading Occidental Petroleum Stock
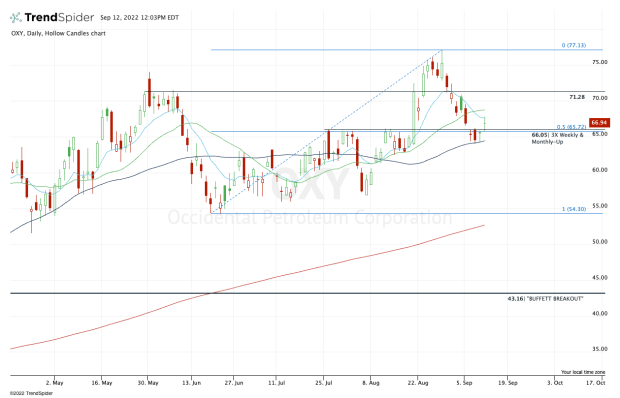
Chart courtesy of TrendSpider.com
When I look at the daily chart above, the most notable thing to me is how Occidental stock held the 50-day moving average and the $64 to $64.50 level over a span of three straight days. That’s a nice area of support that has now been carved out.
Further, the stock was stuck between $65.88 and $66.20 on the upside, while stuck below the prior breakout level under $66.
With today’s rally, Occidental stock has now cleared this area. As a bonus, it held this zone as support after this morning’s initial dip.
So where does that leave us? As it stands, shares have reclaimed prior resistance and the breakout level at $66, held this area as support and hammered out a notable low around $64 and the 50-day moving average.
Those who are bullish may look to ride a long position in Occidental Petroleum, while noting that shares are still struggling with active resistance via the 10-day moving average and need to reclaim the 21-day moving average to see a sustained move to the upside.
For what it’s worth, the weekly chart is relatively clean.
If shares can reclaim the short-term moving averages, then a move to the $71 to $71.50 area could very well be in the cards.
Above that opens the door back to the $75 area and the high near $77.
On the downside, keep it simple. A break of $66 puts $64 and the 50-day back in play. Below that and bullish traders may consider using a stop-loss in the $63 range — particularly on a close below $64 — as their risk management point.