It all began with a visit to Barchart’s Five Day Losers screener. The objective? Among the securities printing red ink, find the one enterprise that has an empirically solid chance of rising higher. You know, be greedy when others are fearful or something. Using an advanced discrete-state analysis (which I’ll explain below), I identified Albertsons Companies (ACI) as a prime candidate.
Under a typical assessment by the financial publication industry, I would state a fact: in the past five sessions, ACI stock declined 7.79%, making it one of the worst performers among major publicly traded companies. Next, I would note that ACI fell below a historical benchmark, such as the price-to-earnings ratio. Finally, I would hit you with a presuppositional fallacy — that Albertsons is undervalued.
Now, to be crystal clear, I do believe that ACI stock is undervalued. However, I am not satisfied with the finpub sector’s explanation for this alleged mispricing.
Let me give you a real-world example. Suppose that you saw a car that you like being sold for $30,000 but it’s a bit out of your price range. A week later, that same car is sold for $20,000. Your instinct wouldn’t be that the car is on a 33% discount. No, you’d ask if it got into an accident or if it fell into misfortune.
Well, we should have the same attitude when it comes to investing and especially options trading. ACI stock declining by nearly 8% and falling to a financial ratio that is itself derived from the falling share price cannot be the justification for its alleged undervaluation.
That’s circular reasoning, not analysis. Sure, the finpub sector often obfuscates the point by deliberately ramping up the word count with loose mentioning of analyst ratings, implied volatility, alpha this, gamma that. At the end of the day, it’s still circular reasoning.
So, let’s get down to the science — and that begins with the null hypothesis.
How to ‘Beat Placebo’ with ACI Stock
In simple terms, the null hypothesis is the default assumption that there is no effect, no difference or no special condition present; regarding ACI stock, the null hypothesis is that there is no mispricing. Therefore, ACI will react as it normally does.
I’ll be looking at Albertsons stock based on a weekly time frame. So, my null hypothesis by the numbers is that, since ACI’s public market debut, the chance that a long position will rise on any given week is 53.41%. In contrast, my alternative hypothesis is that, in part due to ACI’s volatility, there is an empirically strong probability that the security will move higher beyond what is expected by its baseline probability.
Essentially, the point about mentioning the null hypothesis is that it’s the equivalent of a biotech firm’s therapeutic beating placebo. If the drug cannot beat sugar pills combined with the power of positive thinking, then it’s not an effective solution.
To validate my alternative hypothesis, I must categorize the price action of ACI stock into discrete events (which by deduction is the foundation of discrete-state analyses); this way, I can identify which patterns may be empirically significant. To do this, I converted ACI’s price history into market breadth — or sequences of accumulative and distributive sessions — across rolling 10-week sequences, as below:
L10 Category |
Sample Size |
Up Probability |
Baseline Probability |
Median Return if Up |
1-9-D |
1 |
100.00% |
53.41% |
2.00% |
2-8-D |
2 |
50.00% |
53.41% |
2.33% |
3-7-D |
16 |
75.00% |
53.41% |
1.22% |
4-6-D |
37 |
62.16% |
53.41% |
1.98% |
4-6-U |
11 |
72.73% |
53.41% |
2.18% |
5-5-D |
36 |
44.44% |
53.41% |
2.26% |
5-5-U |
20 |
60.00% |
53.41% |
2.43% |
6-4-D |
9 |
55.56% |
53.41% |
2.91% |
6-4-U |
48 |
43.75% |
53.41% |
1.45% |
7-3-U |
34 |
58.82% |
53.41% |
1.94% |
8-2-U |
17 |
58.82% |
53.41% |
0.90% |
9-1-U |
2 |
0.00% |
53.41% |
N/A |
In the trailing two months, ACI stock has printed a 4-6-D sequence: four up weeks, six down weeks, with a negative trajectory across the 10-week period. Since its market debut, ACI has flashed this sequence 37 times. Notably, in 62.16% of cases, the following week’s price action results in upside, with a median return of 1.98%.
Assuming that the bulls can maintain control for the next three weeks, traders may anticipate a 2% boost in added performance. Using Wednesday’s closing price of $20.53 as an anchor, ACI stock could potentially reach $21.36.
Putting Theory into Action
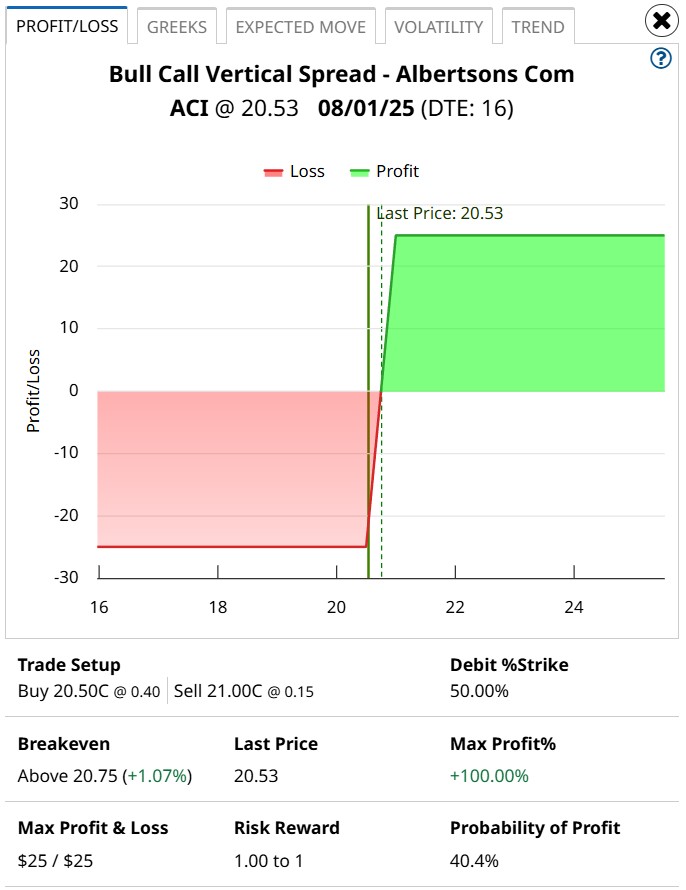
Based on the market intelligence above, the ideal options play may be the 20.50/21 bull call spread expiring Aug. 1. This transaction involves buying the $20.50 call and simultaneously selling the $21 call, for a net debit paid of $25 (the most that can be lost in the trade). Should ACI stock rise through the short strike price ($21) at expiration, the maximum reward is also $25, a 100% payout.
Now, the burning question: is the 4-6-D sequence statistically significant? From a pure scientific perspective, the answer is no. Running a one-tailed binomial test, we arrive at a p-value of 18.37. This means that there’s an 18.37% chance that ACI stock will rise 62.16% of the time randomly rather than as a “consequence” of the 4-6-D pattern.
However, the market is an open system, meaning that outside catalysts can come in and disrupt the paradigm. It’s unlikely that you will find an abundance of statistically significant signals. Still, when adjusting for the wildness of the equities space, I would argue that a p-value below 20% is interesting. In the context of finance, it’s not empty noise.
Of course, it’s not the greatest signal ever, which is why the net debit of $25 is enticing. While the 4-6-D sequence isn’t statistically significant, it leans toward being significant.
Admittedly, discrete-state analysis is a funky methodology. Still, let me leave you with this financial red pill: what’s the p-value of a head and shoulders or a “support” line?
Yeah…that’s what I thought.
On the date of publication, Josh Enomoto did not have (either directly or indirectly) positions in any of the securities mentioned in this article. All information and data in this article is solely for informational purposes. For more information please view the Barchart Disclosure Policy here.