PowerPoint is primarily a visual medium. Rather than use it to create straightforward slides, this course encourages you to maximise it’s true potential.
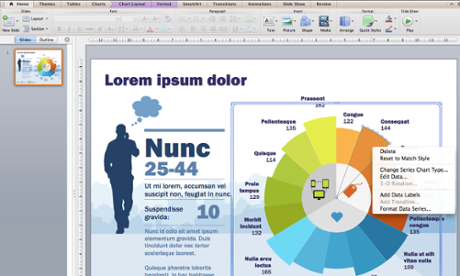
Both within a single slide and across an entire deck, innovative charts and graphs can help to transform data sets into compelling infographics. This course, led by Adam Frost and Tobias Sturt from leading data visualisation agency Graphic, will teach you how to tell powerful visual stories using PowerPoint’s built-in features.
You’ll learn the basic principles of data visualisation, and how you can use it to craft narratives and create eye-catching designs. You’ll also get involved in a practical exercise where you create a sample slide using pen and paper. With detailed handouts and opportunities for feedback, this fun and informative course will be of long-term benefit to your communications.
This course is for you if...
• You have to present as part of your job and want to learn how to create better PowerPoint slides
• You work with data and wish to learn more about turning it into something visually compelling
• You’re a designer who wishes to learn the basics of creating infographics
• You’re a freelancer who is interested in creating more elegant PowerPoint presentations
We also offer bespoke data visualisation training for teams – click here for more information
Course description
This interactive masterclass looks at how raw data can be turned into striking visual stories using PowerPoint software. The course includes a practical exercise in which attendees put together a sample slide using pen and paper. Topics covered on the evening include:
- An introduction to the principles of data visualisation
- Storytelling with PowerPoint
- How to design using PowerPoint
- Practical exercise: create a sample slide using pen and paper
- Tools and further reading
- Q&A and group discussion
Tutor profiles
Adam Frost was formerly head of data visualisation at the Guardian’s Digital Agency. He is now content director at Graphic. His work has appeared on the Guardian, the New Statesman, Buzzfeed and elsewhere. He has produced infographics and interactives for a range of public and private-sector clients including the Department for Education, HMRC, Google, P&G, Nestle and Unilever.
Tobias Sturt was head of Creative at the Guardian’s Digital Agency and is now creative director of Graphic, an agency specialising in data visualisation. He has been working in digital storytelling for almost two decades, in all kinds of media, from web to TV to games to infographics. He has also worked on more conventional digital development projects, from website design to branding, from mobile app interfaces to print projects.
Details
Date: Monday 30 March 2015
Times: 6.30pm-9pm
Location: The Guardian, Kings Place, 90 York Way, London N1 9GU
Price: £119 (includes VAT, booking fee and drinks)
Event capacity: 18
To contact us, click here. Terms and conditions can be found here.
Returns policy
Tickets may be refunded if you contact us at least 14 days before the course start date. Please see our terms and conditions for more information on our refund policy.