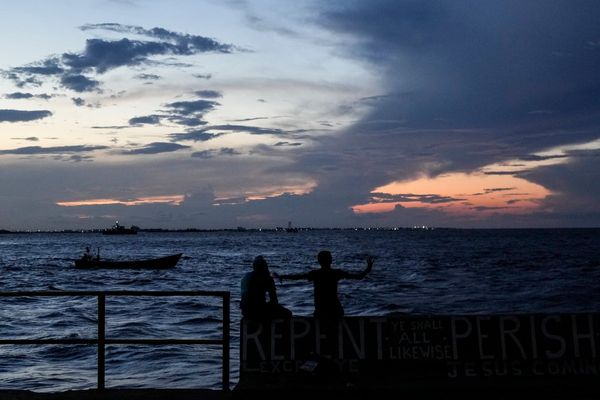
The neighborhood where Emprezz Nontzikelelo struggles to breathe the worst air in America was the only part of Bakersfield where Black families like hers were allowed to live when she was growing up.
Still populated by predominantly low-income people of color, the eastern side of Bakersfield lies downwind of the oilwells, freeways and pesticide-choked agricultural fields of California’s Central Valley and backs up to a busy rail yard that ships the valley’s produce around the nation.
As in Bakersfield, across the US people of color are often the ones forced to live with the nation’s worst fine particle air pollution.
The Guardian worked with academics to analyze air pollution in the contiguous US at a neighborhood level and created a top 10 ranking of local areas breathing the worst air. And a new interactive map allows Americans to see the estimated pollution levels in their neighborhoods at an unprecedented level of detail.
The analysis, based on a model created by a team of researchers at institutions including the University of Washington, shows that the more people of color who live in a neighborhood, the higher the fine particulate air pollution levels are likely to be.
“In our society, people of color are given the least value,” said Professor Robert Bullard, who helped to start the environmental justice movement, and was not involved with the research. He teaches at Texas Southern University in central Houston, which is another air pollution hotspot identified by the Guardian. “The underlying variable that is most predictive is systemic racism,” he said.
And people like Nontzikelelo, 77, bear the brunt. A lifetime of breathing Bakersfield’s air, which has regularly exceeded federal action levels for fine particulate pollution by huge amounts, has left Nontzikelelo struggling with chronic obstructive pulmonary disorder so bad that she has frequently had to temporarily move away from Bakersfield to give her lungs a break and regain her health.
“I have a maintenance inhaler and a rescue inhaler,” said Nontzikelelo, who said she got so sick this summer that she had to go to urgent care to get even more aggressive respiratory treatment. “If we don’t find a way to take our health into our own hands, we will all be walking drugstore timebombs, because you can’t last with this kind of air.”
While the Clean Air Act has prompted steady improvement in air quality around the country in the last five decades, studies by environmental researchers have shown that a wide gap persists in air pollution levels suffered by people of different races.
The Guardian’s map is based on a cutting-edge model developed by Center for Air, Climate and Energy Solutions (CACES), a multi-university research center partnered with the US Environmental Protection Agency (EPA). The model estimates fine particulate air pollution, or PM2.5, at a far more local level than would otherwise be possible.
Usually air pollution is monitored by measuring devices, but they are limited in number. In order to fill in the gaps between physical air monitors, which are often spaced far apart, the model uses satellite, land use and other data to create a prediction of pollutants down to the block level.
Experts say the estimates for individual census tracts represent a “best guess” of the local air pollution levels.
The Guardian’s analysis is based on data recorded between 2011 and 2015, the most recent years available for the national model. The age of the data is typical for current air pollution studies performed by academics. Researchers say pollution patterns tend to remain relatively steady over the years.
A major finding is that residents of the neighborhoods facing the most air pollution in America are twice as likely to be people of color as those in less polluted neighborhoods.
“Communities of color are likely to be more polluted and to be downwind of pollution sources,” said the University of Washington professor Julian Marshall, co-director of CACES, who has worked on several studies using the data that have shown that race is a more significant factor than income. “Over time, the pollution levels have come down, yet the disparities remain.”
Health research has shown that even a small increase in national pollution levels can result in thousands of additional deaths per year.
Fine particulate pollution is measured in micrograms per cubic meter. The EPA says anything over 12 micrograms per cubic meter requires urgent local remedial action. A study, co-authored by the Harvard University biostatistics professor Francesca Dominici, of seniors on Medicare found that, even below that action level, a one-unit increase in PM2.5 raised the risk of mortality enough to result in more than 11,000 premature deaths a year nationally.
The levels in the Guardian’s list of hotspots are well above those believed to be unhealthful by experts.
Researchers have called on the US to tighten its standards for the whole population as well as doing more to make sure that they are enforced evenly in communities of color.
“In the privileged areas, where most of the white people are, they have the socioeconomic status and the expertise to bring the law and say, ‘No you can’t open a power plant in my community,’” said Dominici. “But in the poorest communities, people can always get a back door way of getting a permit.”
Meanwhile there are other looming risks. While it has long been known that air pollution worsens global heating, new studies are exploring how climate change can inversely worsen air pollution. Heatwaves and wildfires have dramatically worsened the PM2.5 levels in parts of the western US.
A 2021 study led by Karen Clay of Carnegie Mellon University suggested that factors including more frequent wildfires and an increase in the number of miles American vehicles travel have already begun to reverse the progress the US has made in cutting its air pollution.
The nation’s PM2.5 air pollution hit its lowest point in 2016 and then began to tick slightly upward, the study found. It increased 5.5% between 2016 and 2018, the study said, reversing a trend that had shown steady improvement since the Clean Air Act was put into place in the 1970s. More recent EPA figures suggest it has continued to nudge upward slightly since then.
The Biden administration has noticed.
In January, it announced plans to lower the action levels for fine particle air pollution by around 25% (to 8-10 micrograms per cubic meter).
It estimated that lowering the levels could prevent 4,200 premature deaths and 270,000 lost work days per year.
These levels would still be higher than those proposed by the World Health Organization, which has set its health guideline for fine particle air pollution far below the US standards at 5 micrograms per cubic meter. It has declared that air pollution “is the single biggest environmental threat to human health”.
Back in Bakersfield, Nontzikelelo hopes to find local solutions to upend the forces that have left Black and brown communities breathing bad air her whole life.
As science offers new ways to pinpoint the communities most burdened by air pollution, Nontzikelelo has joined the burgeoning environmental justice movements that she believes will lead to finally ending pollution disparities. She has volunteered to help advocate against pollution injustice with a local non-profit, worked with local groups working to create more green spaces in her local parks, and is creating a neighborhood paradise of citrus trees, succulents and primroses in her own yard.
“We all deserve to breathe good air – it’s not just for a privileged few,” said Nontzikelelo. “You’ve had the power and the powerless. But the powerless are not going to be powerless any more.”
Methodology
To identify hotspots, The Guardian looked at the clusters of census tracts with the highest long term averages for estimated PM2.5. In California, the state with the nation’s worst air pollution, these were above the current EPA action level of 12 micrograms per cubic meter (µg/m3.) In other parts of the country, the cutoff was just below the action level at 11.5 µg/m3.
The air pollution map and the hotspots calculations are based on a model, created by the Center for Air, Climate and Energy Solutions (CACES), which estimates the total levels of fine particulate matter (PM2.5) for census blocks throughout the contiguous US. The modeling technique was developed through research by Sun-Young Kim, Matthew Bechle, Lianne Sheppard, Adam A. Szpiro, and Julian Marshall of University of Washington; and Steve Hankey of Virginia Tech.
CACES bases its estimates on publicly available PM2.5 concentration measurements from EPA monitors, and uses information about land use (for example, locations of major and minor roads; elevation; and whether an area is urban or rural) and satellite-derived estimates of air pollution and land cover to predict concentrations at locations where there are no measuring devices. Estimates were generated for each census block with population greater than zero, and then population-weighted to obtain an average estimate for each census tract
The Guardian looked at the average annual levels for the most recent five-year period available: 2011 - 2015. We overlaid racial demographic data, using US Census data from the American Community Survey 5-year estimates for 2011 - 2015.
The pollution estimates for each individual census tract represent a “best guess” based on the available data. The results for census tracts in metropolitan regions where there are hotspots are confirmed by other government and nonprofit studies.
In order to narrow the list of most polluted locations for the Top 10, some discretion was required as many areas have similar levels, particularly toward the bottom of the list. Specifically, California's Inland Empire around Riverside County, the Pittsburgh PA area and an industrial area north of Cincinnati were considered for inclusion, but missed the cut.
Special thanks to Professor Julian Marshall and Alvin Chang for advising on this project.