
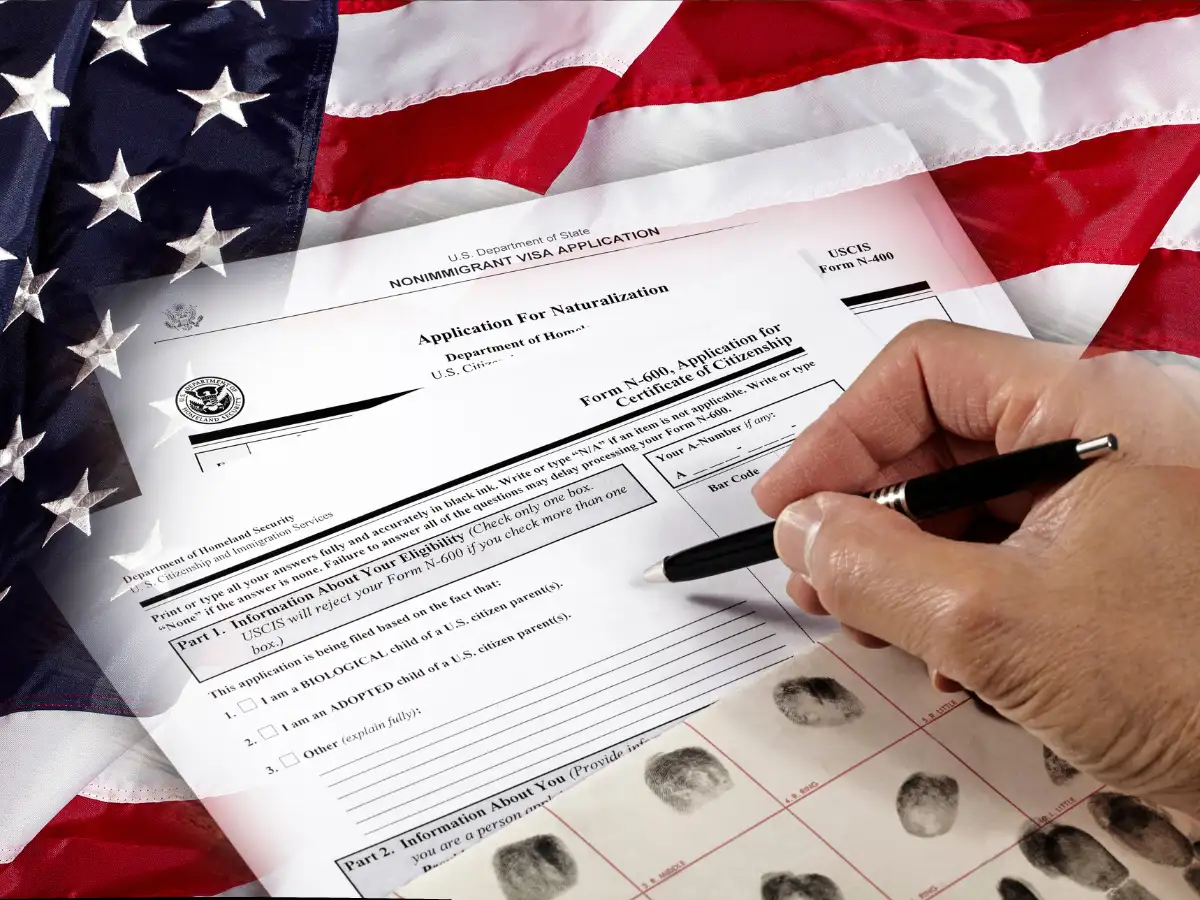
US immigration applicants are facing longer waits and higher denial rates as the backlog at US Citizenship and Immigration Services (USCIS) climbed to 11.3 million applications and petitions in the first quarter of fiscal year 2026, according to the latest data from the American Immigration Council’s USCIS Immigration Filing Trends Dashboard. The dashboard was last updated on August 3, 2026.
The data points to a wider slowdown in immigration processing. USCIS completed fewer cases, pending applications increased and average backlog clearance time nearly doubled compared with the same quarter a year earlier.
Also Read|US moves immigration filings online: What it means for green card, citizenship and asylum applicants
USCIS backlog rises by 1.6 million
The number of pending cases increased by more than 1.6 million, or 16.5%, between FY2025 Q1 and FY2026 Q1. The backlog rose from 9.7 million to 11.3 million applications and petitions.
The increase came even as fewer applications were filed. USCIS received 33.6% fewer applications in FY2026 Q1 than a year earlier and completed 40.8% fewer cases.
USCIS completed only 86 applications for every 100 it received during the quarter. It was the 11th consecutive quarter in which the agency’s efficiency ratio — calculated by dividing completions by receipts — remained below 1.
A ratio below 1 means more cases are entering the system than USCIS is completing, allowing the backlog to grow even when filing volumes decline. The Council’s methodology uses USCIS data and calculates efficiency by comparing completed cases with new applications received.
Work permit backlog jumps 38%
Employment authorisation documents were among the major categories recording a sharp increase in pending applications.
The backlog for Form I-765, Application for Employment Authorization, increased by 446,650 cases, or 38%.
Within this category, pending applications from people with adjustment of status petitions nearly tripled, rising from 154,469 in FY2025 Q1 to 461,884 in FY2026 Q1.
USCIS received a similar number of these applications in the two periods — 163,642 in FY2025 Q1 and 164,763 in FY2026 Q1. But completions fell from 170,256 to 86,756.
As a result, the processing efficiency ratio dropped from about 1.04 to 0.53.
Refugee green card applications face processing slowdown
A sharper slowdown was recorded for Form I-485 adjustment of status applications filed by refugees.
Receipts increased from 16,725 in FY2025 Q1 to 25,746 in FY2026 Q1. However, completed cases fell from 17,756 to just 3,536.
The efficiency ratio dropped from 1.06 to 0.14. This means USCIS completed about 14 applications for every 100 it received during the quarter.
USCIS backlog clearance time nearly doubles
Applicants are also facing longer waits for decisions. Across all USCIS forms, average backlog clearance time increased from 9.4 months in FY2025 Q1 to 18.6 months in FY2026 Q1. Calendar-year figures show a similar trend. Average backlog clearance time increased 61.8%, from 8.9 months in 2024 to 14.4 months in 2025.
| Category | Earlier period | Latest period | Change |
|---|---|---|---|
| All USCIS forms | 9.4 months | 18.6 months | Nearly doubled |
| Calendar-year average | 8.9 months (2024) | 14.4 months (2025) | +61.8% |
| I-485 applications filed by asylees | 7.7 months | 70.6 months | More than 8-fold |
The Council calculates backlog clearance time by comparing pending cases with completions to estimate how long USCIS would take to clear its backlog at the current processing capacity.
Some immigration categories saw much larger increases. For Form I-485 adjustment of status applications filed by asylees, backlog clearance time jumped from 7.7 months in FY2025 Q1 to 70.6 months in FY2026 Q1.
USCIS denial rate climbs to 12.2%
Higher denial rates added to the concerns for immigration applicants. The overall USCIS denial rate increased from 8.9% in FY2025 Q1 to 12.2% in FY2026 Q1. Employment-based immigration categories recorded some of the largest increases.
Across all EB-1 petitions, the denial rate increased from 13.9% to 30.1%. These categories cover applicants including highly skilled workers, researchers, physicians, entrepreneurs and people with exceptional qualifications. For EB-1A Extraordinary Ability petitions, the denial rate more than doubled from 25.3% to 52.5%.
| Immigration category | FY2025 Q1 denial rate | FY2026 Q1 denial rate |
|---|---|---|
| All USCIS applications and petitions | 8.9% | 12.2% |
| All EB-1 petitions | 13.9% | 30.1% |
| EB-1A Extraordinary Ability | 25.3% | 52.5% |
| EB-2 National Interest Waiver | 37.3% | 57.4% |
Humanitarian parole denial rate reaches 88.7%. Humanitarian immigration categories also recorded higher denial rates. The denial rate for humanitarian parole applications increased from 52.9% in FY2025 Q1 to 88.7% in FY2026 Q1. For parole in place applications, denials increased from 18.4% to 45.8%. Advance parole applications saw their denial rate rise from 29.9% to 46.7%.
Also Read| US visa for children: Minors of all ages must attend interview, US Embassy tells Indian parents
Immigration processing slowdown extends beyond one quarter
The slowdown is not limited to one quarter. A comparison of calendar-year averages for 2024 and 2025 shows the same broad pattern — fewer applications received, more pending cases, higher denial rates and longer backlog clearance times.
The American Immigration Council said the consistency across these measures indicates that the slowdown reflects a broader shift in USCIS processing rather than normal quarter-to-quarter changes.
The Council’s dashboard tracks USCIS data covering applications received, completed and pending, along with approval and denial rates, processing efficiency and estimated backlog clearance times.







.jpeg?w=600)