It’s not the greatest-sounding endorsement you can receive. Thanks to its market loss of nearly 24%, Upstart Holdings Inc (UPST) ignominiously made up the ranks of Barchart’s one-month losers list. If that wasn’t enough shame, the platform’s technical opinion indicator rates UPST stock as a 56% Sell, warning of a weakening short-term outlook.
Ordinarily, I would be inclined to agree. With Wall Street analyst rating shares as a consensus Hold — and three individual voices rating it a Strong Sell — Upstart appears to be headed down the wrong path. Further, in the past one-year period, the equity lost 3.48%.
At a time when innovators are flying high, the red ink stings. Nevertheless, UPST stock just flashed a quantitative signal that suggests upside could be just over the horizon.
It comes down to the numbers. Because the market represents a constant negotiation between bulls and bears, it necessarily means that if a trade occurs, there’s someone on the other end of it. Mechanically, this means that, at the end of every session, there will be a winner and there will be a loser.
Statistically, calculating the exceedance ratio — how profitable one is projected to be over a given amount of time relative to the starting point — is a mostly straightforward exercise. Basically, you take past analogs and project outward. The expected outcomes can also be plotted as a distributional curve for visual analysis.
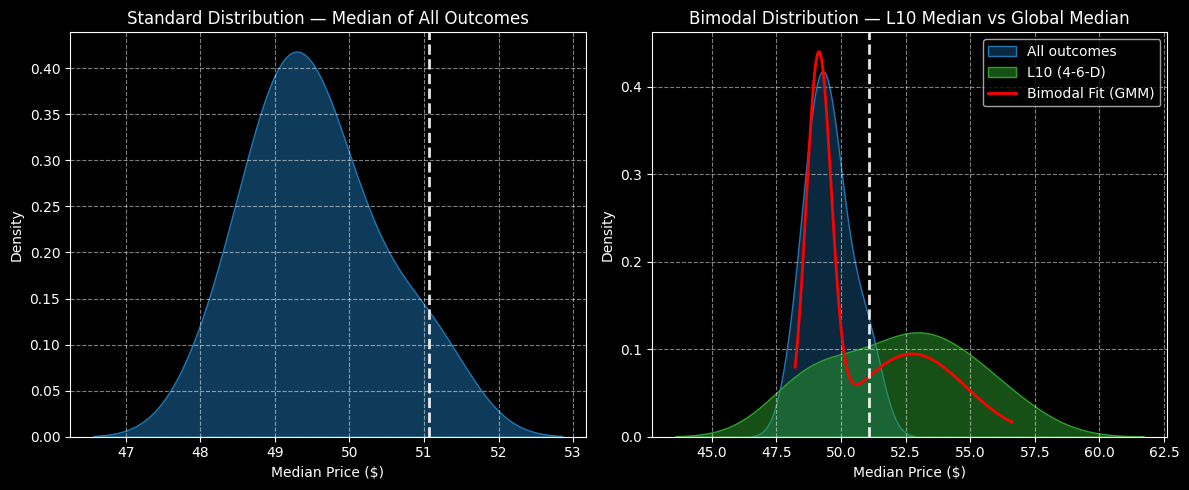
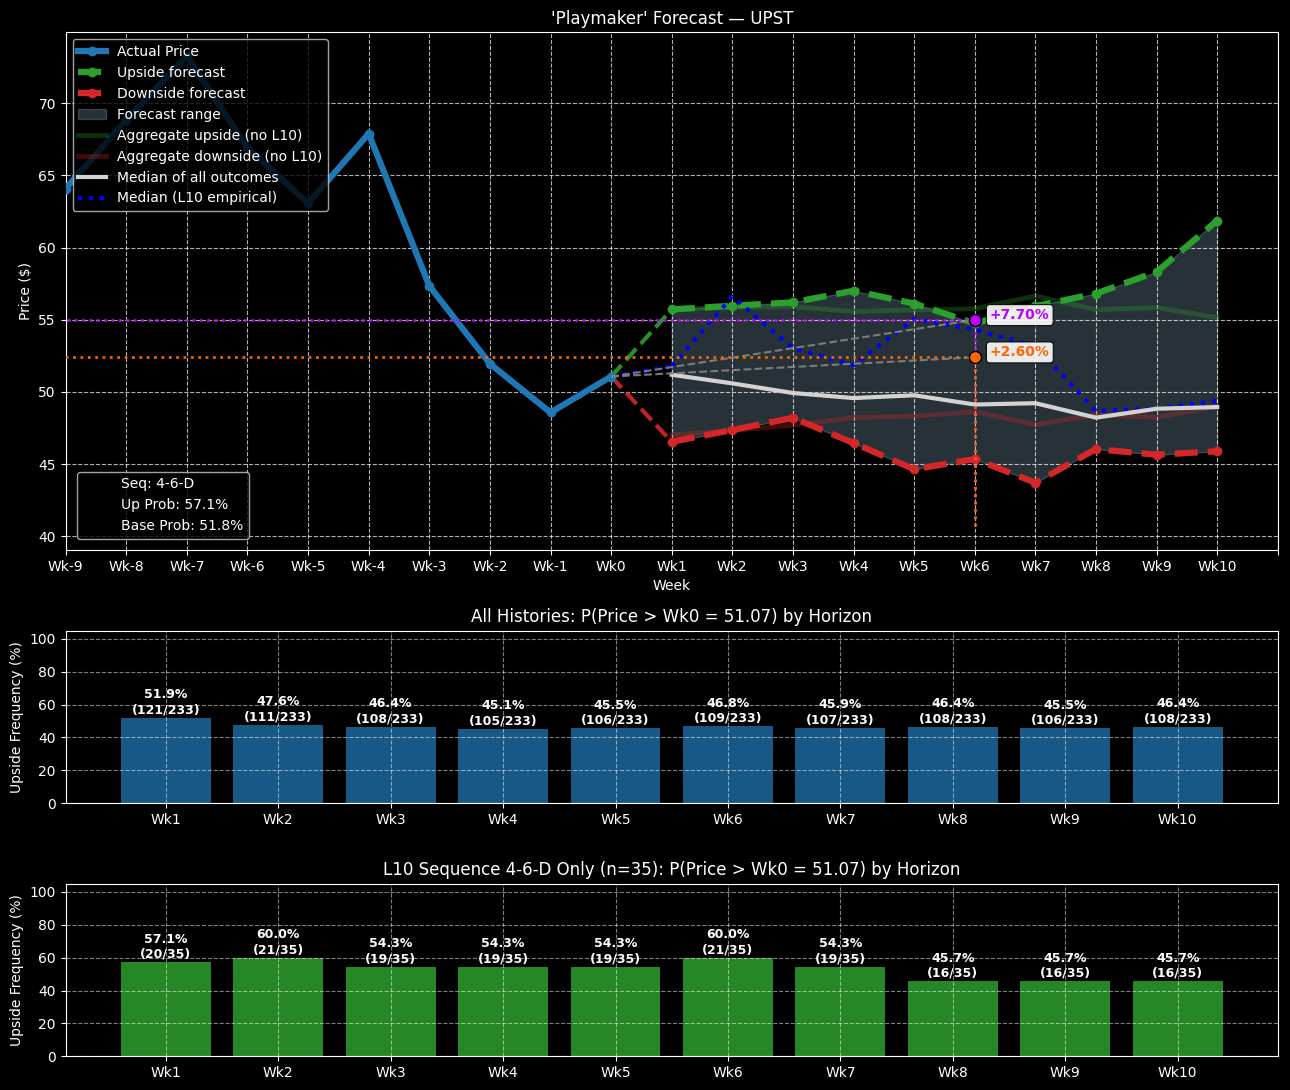
From a quantitative approach, the issue with UPST stock is that it suffers from a negative bias. Using data going back to its public market debut, UPST’s exceedance ratio over a 10-week period is only 46.4%. Nominally, most prices are projected to land between $47 and $53, with the bulk of outcomes expected to splatter between $48.50 and $50.50.
The problem? UPST stock closed on Wednesday at $51.07.
An Opportunity in the Data Emerges for UPST Stock
At this point, most quantitatively minded traders will probably look for more compelling opportunities, such as deflated tech entities with an upward bias. However, under GARCH (Generalized Autoregressive Conditional Heteroskedasticity) analyses, we know that volatility clusters rather than diffuses linearly and independently.
Put simply, volatility tomorrow depends largely on the magnitude of volatility today. Further, near-term stimuli are much more influential than stimuli that occurred ages ago. This is all common-sense stuff but it represents the foundation of data science in the financial markets.
Now, the fulcrum is that UPST stock is not in a homeostatic state but is instead under duress. Again, UPST being included in Barchart’s one-month losers list confirms the point. However, what makes this loser different from most other underperformers is that UPST has a history of responding positively to pressure.
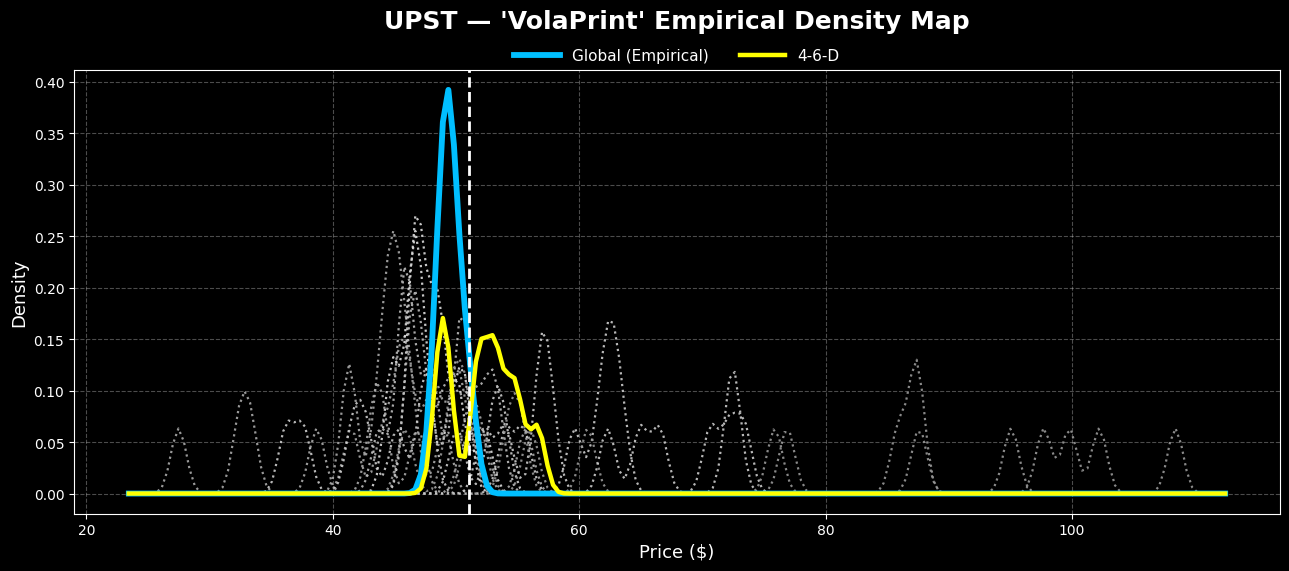
Quantitatively, Upstart stock is structured in a 4-6-D formation: four up weeks, six down weeks, with a downward trajectory. The sequence itself isn’t inherently special. What is special is that, with the use of advanced algorithms that I developed, we can isolate the empirical behavior of this sequence to determine if there is an improvement in performance relative to the baseline.
As it turns out, there is.
Under 4-6-D conditions, the exceedance ratio peaks at 60% at Week 6 before fading to 45.7% in Week 10. Further, the bulk of outcomes would be expected to fall between $50 and $55. That means there’s still risk involved and the extreme bearish end of the probabilistic distribution curve falls below $45.
In summary, under baseline conditions, UPST stock is likely to be unprofitable. Under the “sequential” condition, UPST is likely to be profitable but with enhanced black-swan risk.
No, it’s not the cleanest contrarian case that I’ve ever come across. But if you’re looking for a smart speculative play, Upstart should be on your radar.
A Specific Trading Idea to Consider
You know what the beautiful part about using data science is? We can better pinpoint trading ideas because they’re tied to math, not to emotions or heuristics.
Based on the intelligence above, the 50/55 bull call spread expiring Nov. 21 really stands out. Here, UPST stock must rise through the second-leg strike price ($55) at expiration — and the median price of the 4-6-D sequence would be targeting around $54.80. Better yet, the breakeven price is only $52.40, which is a very realistic target based on past analogs.
For those who are feeling extra ambitious, the 52.50/57.50 spread expiring on the same day could be enticing. Should UPST stock rise through the upper price target, the maximum payout stands at over 138%.
On the date of publication, Josh Enomoto did not have (either directly or indirectly) positions in any of the securities mentioned in this article. All information and data in this article is solely for informational purposes. For more information please view the Barchart Disclosure Policy here.