While history may not be guaranteed to repeat, those who follow the quantitative methodology may want to keep their eyes on United Natural Foods (UNFI). UNFI stock has been shaking things up on Wall Street, gaining roughly 3% last week and rising over 31% in the trailing month. Despite this tremendous performance, UNFI is only up a little over 3% for the year, raising some questions about sustainability.
If unusual options activity is any barometer, United Natural could still have some legs remaining.
Heading into the weekend, UNFI stock represented one of the 500 names making up Barchart’s Unusual Stock Options Volume screener. Total volume hit 4,687 contracts, representing a 46.79% lift over the trailing one-month average. Interestingly, though, call volume reached only 673 contracts, while put volume jumped to 4,014 contracts, yielding a put/call ratio of 5.96.
On the surface, this would seem to imply more traders buying puts than calls, implying a bearish posture. However, unusual options activity is a tricky beast because the contracts can be either accumulative (debit-based) or distributive (credit-based).
Options flow, which focuses exclusively on big block transactions likely placed by institutional investors, provides additional clues regarding sentiment. On Friday, net trade sentiment stood at $12,000 above parity, with the bullish positions being bought calls. As for the high volume of puts, most of them expire in January 2027, implying a hedged position.
A Bullish Signal Flashes a Second Time for UNFI Stock
While I believe that unusual options activity represents an important datapoint — potentially indicating what the smart money may be thinking about — analysts must do a lot of inference. There’s no magic behind these numbers. Unless you’re interviewing all options traders and they agree to disclose their strategies, you’re never really 100% sure what the unusual activity signifies.
In other words, unusual options — like so many other screeners and indicators — reveal facts, not necessarily truth.
That might sound like a controversial statement but here’s what I’m trying to say. Ultimately, as traders, we’re seeking asymmetric risk-reward setups. However, we’re likely not going to reliably find such favorable asymmetry through facts. For the most part, the common narratives all stem from those facts and now, AI engines are absorbing them and spitting out content at an exponential rate.
To have an edge, we need to look at truth. And the only objective truth I see in the past ten weeks is that the market voted to buy UNFI stock six times and voted to sell four times, yet the overall trajectory during this period was negative. For brevity’s sake, we can label the sequence as 6-4-D.
At first glance, it may seem odd to compress the price action of UNFI stock into a simple binary code. But by doing this, we can analyze the sentiment voting record if you will of United Natural. Going back to January 2019, it’s possible to extract UNFI’s full demand profile:
L10 Category |
Sample Size |
Up Probability |
Baseline Probability |
Median Return if Up |
1-9-D |
2 |
50.00% |
58.77% |
3.58% |
2-8-D |
6 |
66.67% |
58.77% |
3.61% |
3-7-D |
16 |
43.75% |
58.77% |
1.71% |
4-6-D |
34 |
61.76% |
58.77% |
3.03% |
4-6-U |
10 |
70.00% |
58.77% |
2.99% |
5-5-D |
37 |
62.16% |
58.77% |
5.06% |
5-5-U |
23 |
30.43% |
58.77% |
4.76% |
6-4-D |
35 |
71.43% |
58.77% |
3.42% |
6-4-U |
25 |
56.00% |
58.77% |
4.01% |
7-3-D |
9 |
55.56% |
58.77% |
3.20% |
7-3-U |
55 |
67.27% |
58.77% |
4.63% |
8-2-D |
3 |
33.33% |
58.77% |
0.07% |
8-2-U |
28 |
42.86% |
58.77% |
3.64% |
9-1-U |
4 |
75.00% |
58.77% |
5.02% |
Effectively, the null hypothesis — that is, a bullish wager on UNFI stock assuming no mispricing — is a next-week upside probability of 58.77%. In any given week, UNFI bulls enjoy a fairly strong upward bias. However, the 6-4-D is our alternative hypothesis, which claims that the odds have now jumped to 71.43%.
What’s more, the median return assuming the positive pathway is 3.42%. Should the bulls maintain control of the market for the next three weeks, investors may anticipate an additional median performance boost of 2.53%. With UNFI stock closing at $28.21 on Friday, it could theoretically be on course to hit $29.91, possibly up to $30 given the psychological significance.
Enticingly, there’s precedent here. At the beginning of the month, I noted that UNFI stock had flashed the same 6-4-D sequence (though the anticipated success ratio at the time was slightly lower at 70.59%). Back then, I focused on the 23/25 bull call spread expiring July 18.
Look at the chart. Sure, the spread left some cash on the table but come on! The dynamic, the ebb and flow, was called almost perfectly.
Going for a Repeat Performance
To be perfectly clear, I’m not going to sit here and tell you that the market is guaranteed to give you another swing at the ball. Even assuming that the 71% success rate is totally accurate (which is a difficult claim to make given the market’s open system), it still means a chance of failure 29% of the time.
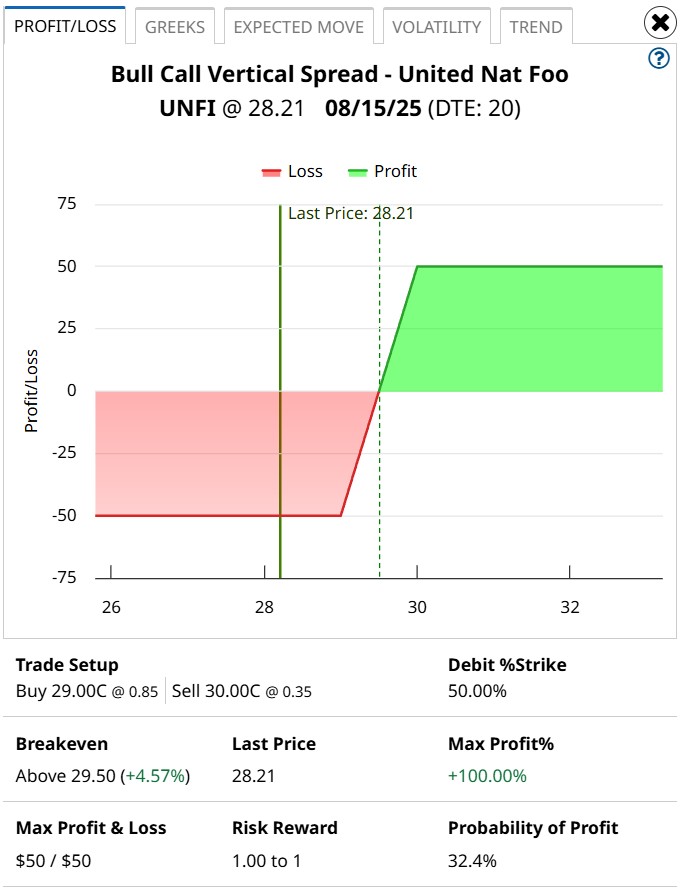
With that said, I’m very interested in the 29/30 bull call spread expiring Aug. 15. This transaction involves buying the $29 call and simultaneously selling the $30 call, for a net debit paid of $50 (the most that can be lost in the trade). Should UNFI stock rise through the short strike price at expiration, the maximum reward is also $50, a payout of 100%.
While I can’t provide any guarantees, I genuinely believe that the 6-4-D sequence is empirically intriguing. Running a one-tailed binomial test reveals a p-value of 0.1832, meaning that there’s an 18.32% chance that the forecasted outcome of the 6-4-D could occur by chance rather than by “intention.”
Scientifically, such a high p-value would be considered statistically insignificant. Nevertheless, the entropy of the stock market means that, I as a forecaster, should receive some wiggle room.
Besides, you’ve seen the sequence flash before. If you believe that lightning can strike twice, this is your chance.