UK unemployment has tumbled to its lowest level since 2008, when the fall of the US investment bank Lehman Brothers brought the global economy to the brink of collapse.
Here are the five main points from today’s unemployment report (which is online here).
Britain has recorded the largest annual fall in unemployment on record.
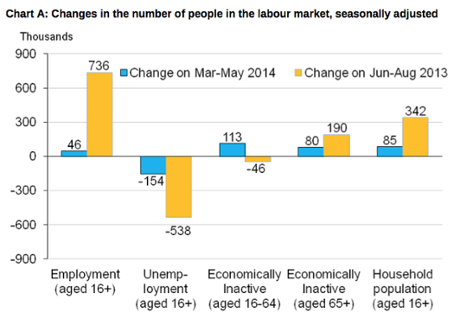
There are now 1.97 million unemployed people, 154,000 fewer than for March to May 2014 and 538,000 fewer than a year earlier.
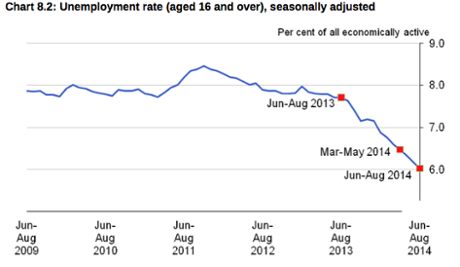
The unemployment rate has hit its lowest rate since late 2008.
It dropped to 6.0% in the June to August quarter.
Real wages are still shrinking
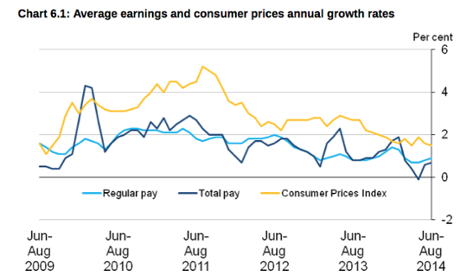
But the recovery hasn’t reached people’s pockets yet, as wages continue to lag inflation.
Pay including bonuses for employees in Great Britain was 0.7% higher than a year earlier. Pay excluding bonuses for employees in Great Britain was 0.9% higher than a year earlier.
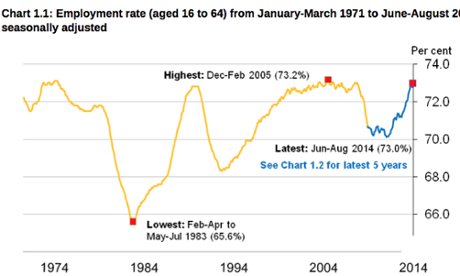
Britain’s employment rate has risen, but job creation has slowed
There are now 30.76 million people in work in Britain. That’s 46,000 more than for March to May 2014, the smallest quarterly increase since March to May 2013.
The employment rate is now 73.0%, from 71.5% a year ago....
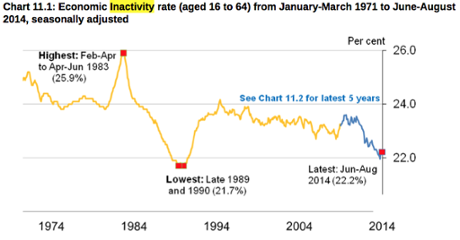
Inactivity is rising too
More than 113,000 people dropped out of the labour market altogether during the quarter. That pushed up the economic inactivity rate:
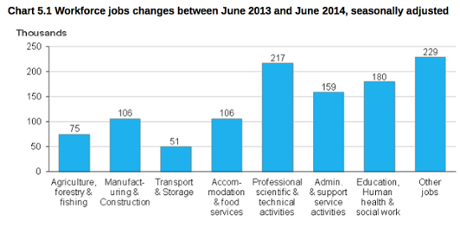
And here is where the new jobs have been created: