Judging from unusual options activity alone, Uber Technologies (UBER) may be under some stress and for understandable reasons. While UBER stock has been stellar performer this year — gaining just over 53% year-to-date — the security is losing momentum recently. In the trailing month, for example, UBER slipped more than 6%.
This past week, the equity gave up 2.5% amid tech sector volatility. Sure enough, the options market didn’t provide a convincing signal for the bulls.
Following Friday’s close, UBER stock options volume reached 113,742 contracts, down 3.42% from the trailing-month average. Yes, call volume landed at 69,831 contracts, above the put volume count of 43,911 contracts. However, options flow — which focuses exclusively on big block transactions — showed that net trade sentiment was $595,900 below parity, thus favoring the bears.
If that wasn’t convincing enough, net trade sentiment in the prior session was $3.25 million below parity. From a cumulative perspective last week, the overall flow was negative. With both the smart money and retail investors looking to exit, UBER stock would seem to be highly risky.
At the same time, the ride-sharing giant also flashed a rare quantitative signal that implies a likelier prospect of upside over the next several weeks.
Explaining the Taxonomical Approach to Market Trading
Over the past few months, I’ve deployed a unique analysis that contrasts heavily with the traditional fundamental and technical approaches. The problem is explaining the underlying first-order Markov chains and the probabilistic distributions that stem from the analysis. Having thought this through, the best explanation comes from marine ecology.
As you know, the ocean is a vast space. To study the behaviors and migration patterns of specific sharks, scientists must tag them. By doing so, they discover that great white sharks, for example, have far different behaviors and travel much greater distances than reef sharks. My contribution to the financial ecosystem is this: we can apply the same tagging process but to market sequences.
Of course, share prices are continuous scalar signals, which makes categorization difficult, if not impossible. But by converting this scalar signal into a discrete one, suddenly, prices have defined boundaries. These boundaries, when clumped together, form distinct behavioral states.
Next, we know through GARCH (Generalized Autoregressive Conditional Heteroskedasticity) studies that volatility doesn’t diffuse linearly but clusters; that is, volatility today is highly dependent on volatility yesterday. It stands to reason, then, that the immediate market catalyst is much more influential than a catalyst in the deep past.
Extending the logic, a quant signal that’s flashing right now is much more meaningful than one that flashed five years ago. Right now, the opportunity is that UBER stock has just dropped the contrarian green flag — and it’s up to you if you want to respond to it.
Putting UBER Stock on the Radar
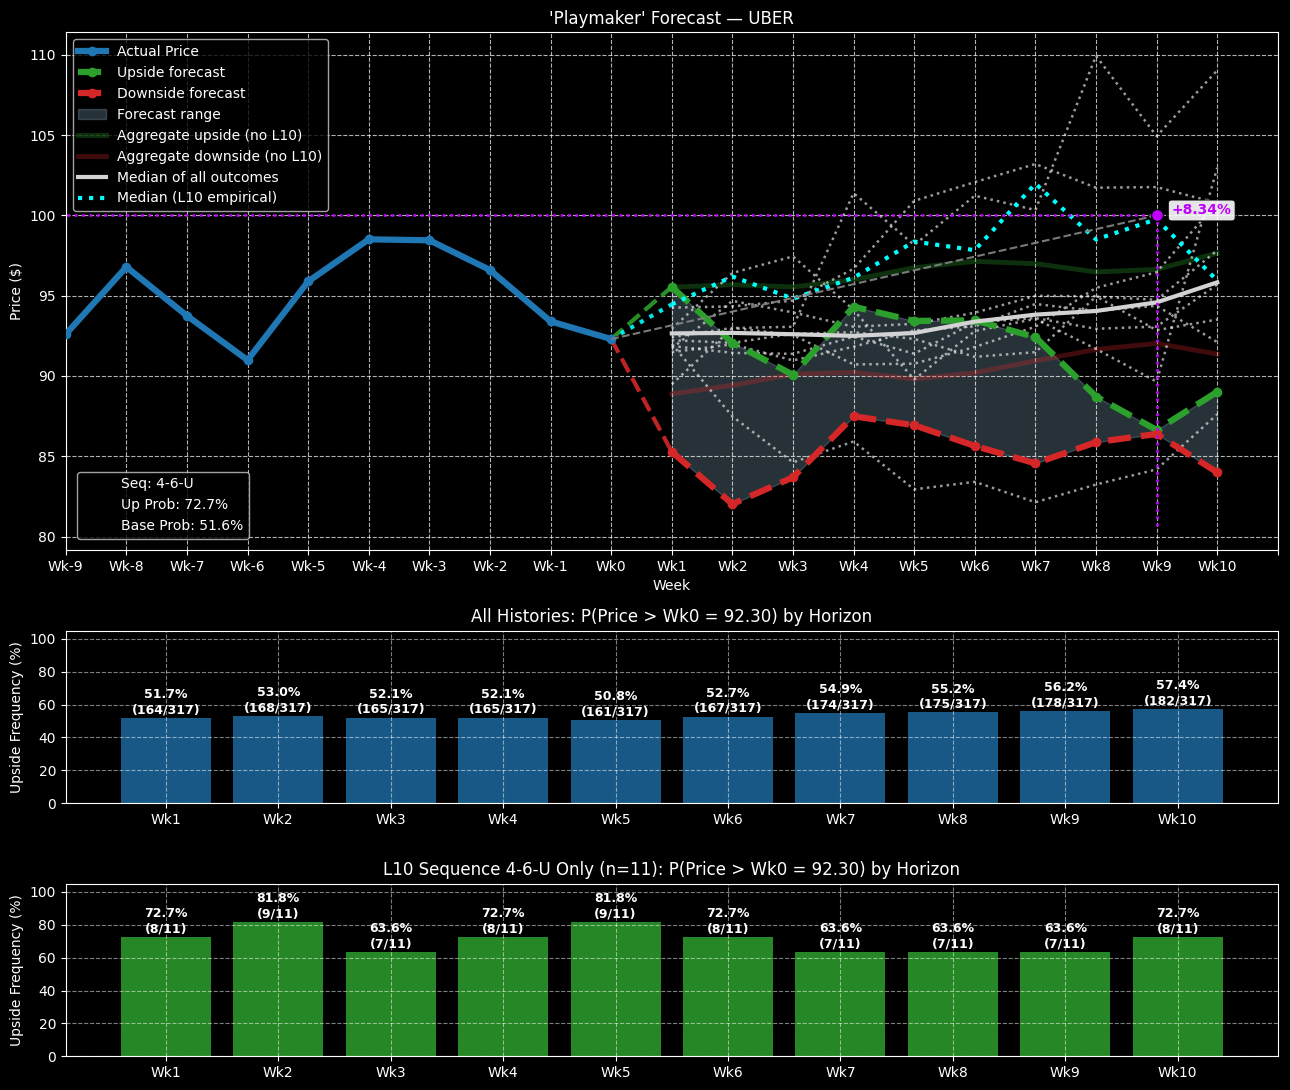
In the past 10 weeks, UBER stock has flashed a 4-6-U sequence: four up weeks, six down weeks, with an overall upward trajectory. With the direction of the security being counterintuitive to the balance of distributive sessions, the 4-6-U is a rare sequence, representing only 3.47% of all identifiable patterns.
To be sure, it’s risky jumping on a signal with such a small sample size. However, the contrarian play is a tempting one.
Under baseline conditions, the 10-week-out exceedance ratio (profitability rate) of a long position is 57.4%. Investors may expect to generally cluster near $93, with the bulk of prices landing between $92 and $94 (assuming an anchor price of $92.30, Friday’s close).
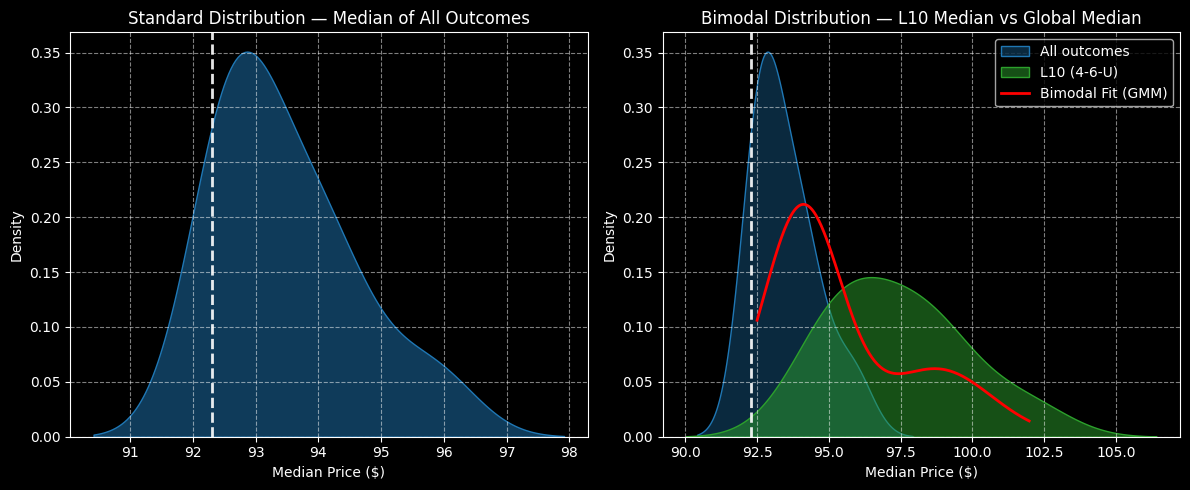
However, under 4-6-U conditions, the 10-week exceedance ratio clocks in at 72.7% (again, keeping in mind the small sample size). Further, prices would be expected to cluster around $96, indicating a much more robust bullish bias.
Even better, on a week-to-week terminal basis, the median price of the 4-6-U sequence would be expected to reach around $100 by the December monthly options chain. Market makers aren’t really anticipating such a move, which means that vertical spreads targeting the $100 price point may be favorably mispriced.
Now, to make matters as crystal clear as possible, these are probabilities based on how the specific quant signal has played out in the past. There is no guarantee that circumstances will play out like this again. That said, if you’re looking for an empirical mechanism of trading options, it’s difficult to overlook this taxonomical approach.
Laying Out a Specific Idea
Based on the market intelligence above, I’m tempted with the 97.50/100 bull call spread expiring Dec. 19. This transaction would need UBER stock to rise through the second-leg strike price at expiration, which is statistically a realistic target when considering the empirical data. Here, the payout clocks in above 127% if the trade is fully successful.
Those who are really aggressive may consider the 97.50/105.00 bull spread, also expiring Dec. 19. In this case, the max payout soars to over 226%. However, the $105 target could be a bit ambitious. Nevertheless, I do like that the breakeven price is $99.80, which softens the probabilistic steepness.