NVIDIA Corporation (NASDAQ:NVDA) was trading slightly higher Wednesday as the company heads into its second-quarter 2023 earnings print after the close.
When Nvidia printed a first-quarter earnings beat on May 25, the stock opened lower the following day but ran into a group of buyers who caused the stock to soar up over 11% off the open. Nvidia soared an additional 9.75% over the next four trading days before entering into a downtrend, which brought it to a low of $140.55 on July 5.
For the first quarter, Nvidia reported earnings per share of $1.36, beating a consensus estimate of $1.29 by 5.43%.
For the second quarter, analysts, on average, estimate Nvidia will report earnings per share of $1.25 on revenues of $8.1 billion. Traders and investors will also be paying attention to how Nvidia guides its earnings for the next quarter.
During the month of August, a number of analysts have weighed in on Nvidia, with all five analysts lowering their price targets. The new price targets come in between $180 and $250.
From a technical analysis perspective, Nvidia’s stock looks bearish heading into the event, having settled into a possible head-and-shoulders pattern on the daily chart.
It should be noted that holding stocks or options over an earnings print is akin to gambling because stocks can react bullishly to an earnings miss and bearishly to an earnings beat.
The Nvidia Chart: After hitting a low near the $140 mark on July 5, Nvidia started to trend higher. Recent price action between the $162 and $191 level may have settled the stock into a bearish head-and-shoulder pattern on the daily chart.
- The head-and-shoulder pattern developed between July 19 and Wednesday, with the right shoulder printing between July 19 and July 26, the head between July 27 and Aug. 8 and the left shoulder over the days that have followed.
- If the pattern becomes recognized, the measured move is about 16%, which indicates Nvidia could fall back toward the $140 level.
- Whether or not the head-and-shoulder pattern plays out will likely depend on whether Nvidia receives a bullish or bearish reaction to its earnings print. If the reaction is bearish, traders will want to see the stock drop down through the ascending neckline of the pattern on higher-than-average volume to indicate the pattern was recognized.
- If the stock receives a bullish reaction to its earnings print, bullish traders will want to see the stock regain the eight-day and 21-day exponential moving averages to negate the head-and-shoulder pattern and Nvidia’s recent downtrend.
- Nvidia has resistance above at $180.73 and $187.80 and support below at $161.37 and $145.45.
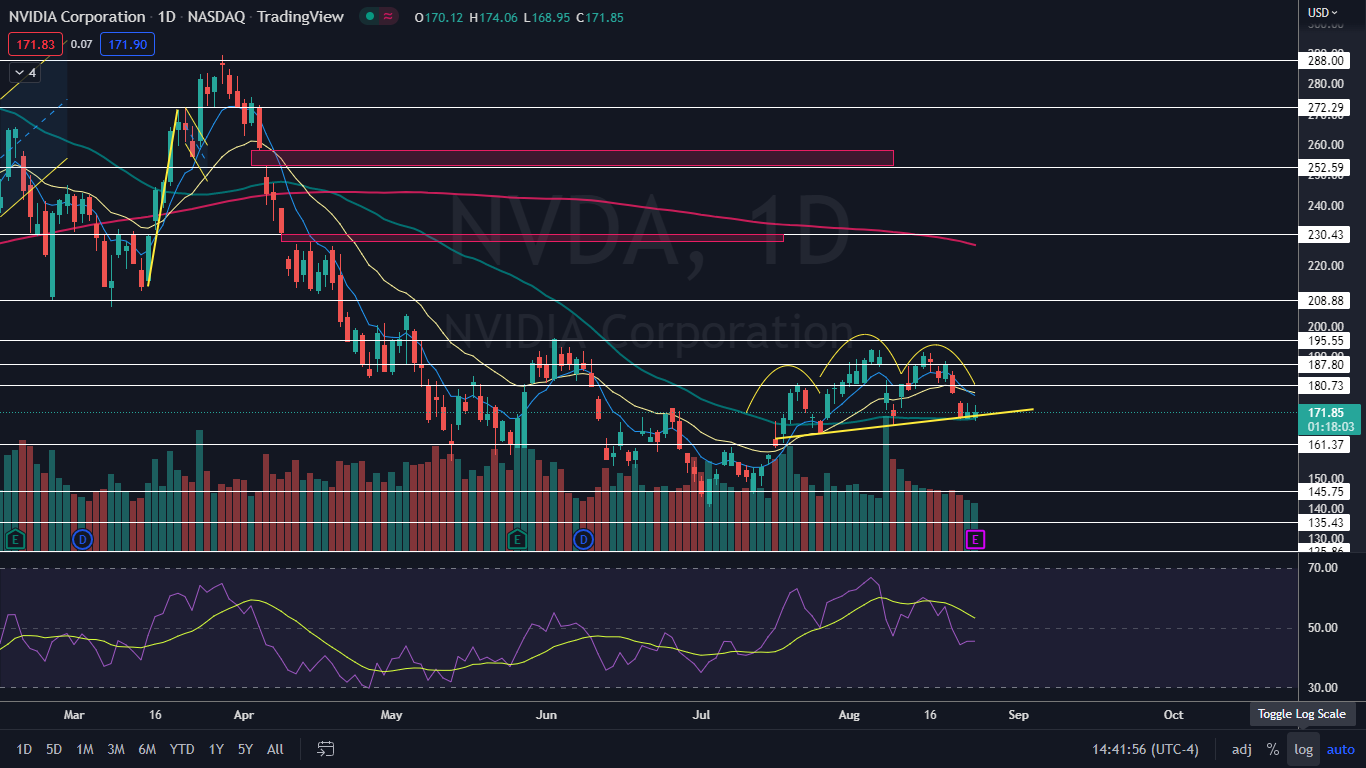
Photo courtesy of Nvidia.